Integrated Visualization
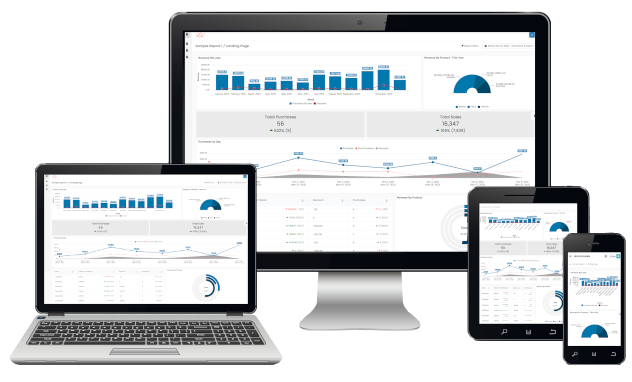
Launchpad's integrated visualization suite has been thoughtfully designed to help organizations deliver access to data
in a modern, customizable and brand friendly experience.
Unprecedented control
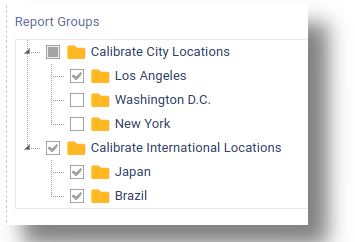
Launchpad - Visualization is perfect for both customers and stakeholders, thanks to the platform's granular user permissions and report assignments. These allow for reports to be shared with multiple users, each with varying levels of access. That means that users only see the data relevant for them, without needing to copy the reports and create custom versions for different users or user groups — like you would need to with many other visualization tools.
Advanced features
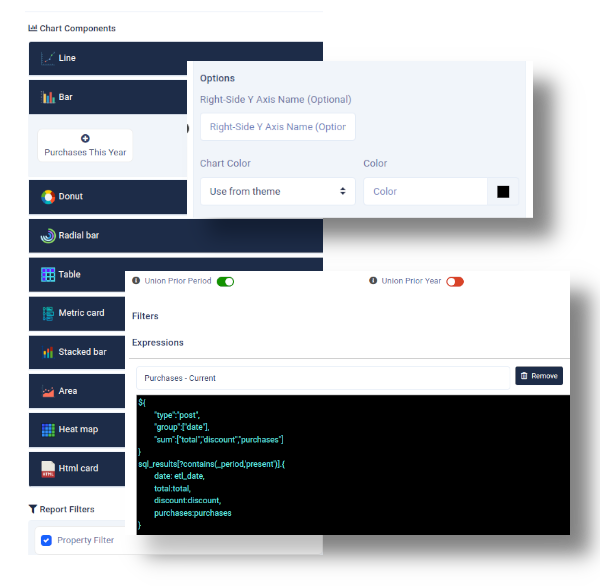
Not only does Launchpad - Visualization provide you with a wide range of charts and graphs to choose from, but you can even apply your brand colors to create reports that really catch the eye. The technology under the hood is equally impressive, with features like data blending, where multiple data sources are combined in a single chart or graph, and the ability to optimize queries, which allows for true data re-use instead of separate queries for each chart.
Visualization types
An Ever-Expanding Library.
-

Area graph
Supports multiple and/or mixed series, right-side Y axis, sparkline format and more.
-

Bar chart
Supports multiple and/or mixed series, vertical bars, right-side Y axis, sparkline format and more.
-

Line graph
Supports multiple and/or mixed series, custom line options, right-side Y axis, sparkline format and more.
-

Stacked bar chart
Supports multiple and/or mixed series, custom line options, right-side Y axis, sparkline format and more.
-

Pie chart
Supports angled slices, whole or half chart, sparkline format and more.
-

Donut chart
Supports sparkline format and more, half and whole donut, nightengale (area or radius) formats and more.
-

Funnel chart
Supports ascending and descending logic, custom gap segment size and inside vs outside labels.
-

Radial bar chart
Supports normal and sparkline formats.
-

HTML card
A free-style WYSIWYG HTML editor to design your own component, complete with replacement variables for values inputs.
-

Metric card
Metrics with comparison values for prior year/period. Use alone or in a chart group to build another component.
-

Data Table
Supports period comparison values, value replacement, sorting, totals and more.
-

Heat map
Supports sparkline optional format, show/hide labels and custom marker radius.
-

Calendar heat map
Supports min/max months displaid and optional accompanying X/Y stats graph.
Scalable and cost-effective
One of Launchpad - Visualization's biggest strengths is its ability to adapt to the needs of your business. Enjoy affordable, scalable pricing that makes it easy to get started, whether you're just beginning your analytics journey or ready for an enterprise-level solution.