If you are a Looker Studio power user, you are probably connecting to a Google Sheet as a table for select datasets and manually updating your sheet several times per month. If you are ready to move away from manually updating sheets and on to a fully automated approach, you will need an Extract, Transform, and Load (ETL) application, as well as a data warehouse, such as Google BigQuery.
Getting started with BigQuery doesn't have to be intimidating. With the right tools, you can automate your Google Sheet process with a quick BigQuery setup and then manage transformations directly in Looker Studio, just like you were doing with the manual setup.
Four Easy Steps to Automate Data in Your Looker Studio Reports
- Connect to your data via an ETL
- Transfer your data to Google BigQuery
- Connect Looker Studio to your data (table) in BigQuery
- Connect your charts in Looker Studio to the new data source
Connect to your data via ETL
- Select an ETL that can connect to your data sources
Examples of common data sources:- Bing
- Google Analytics
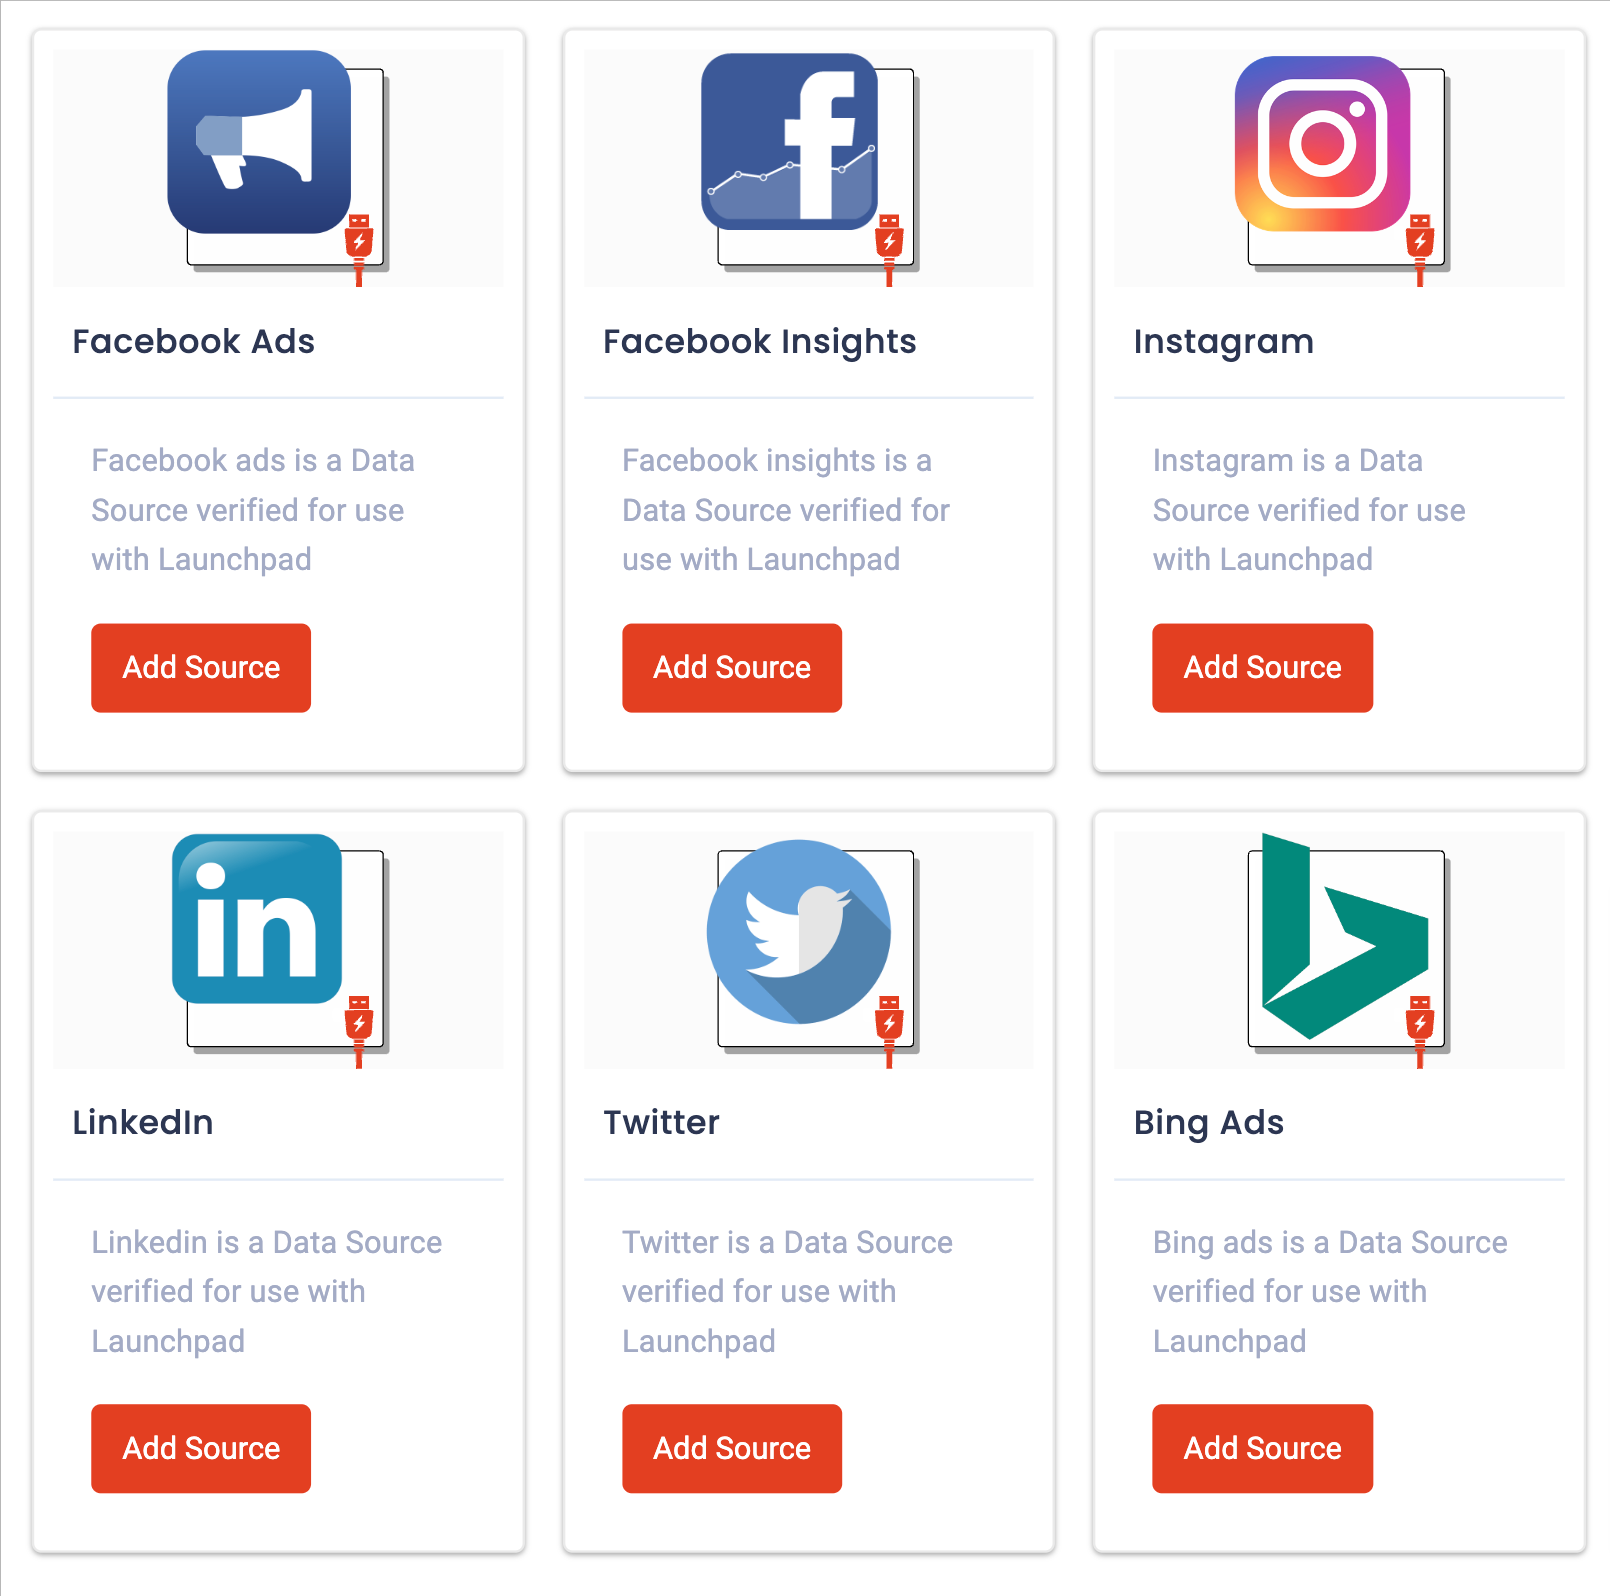
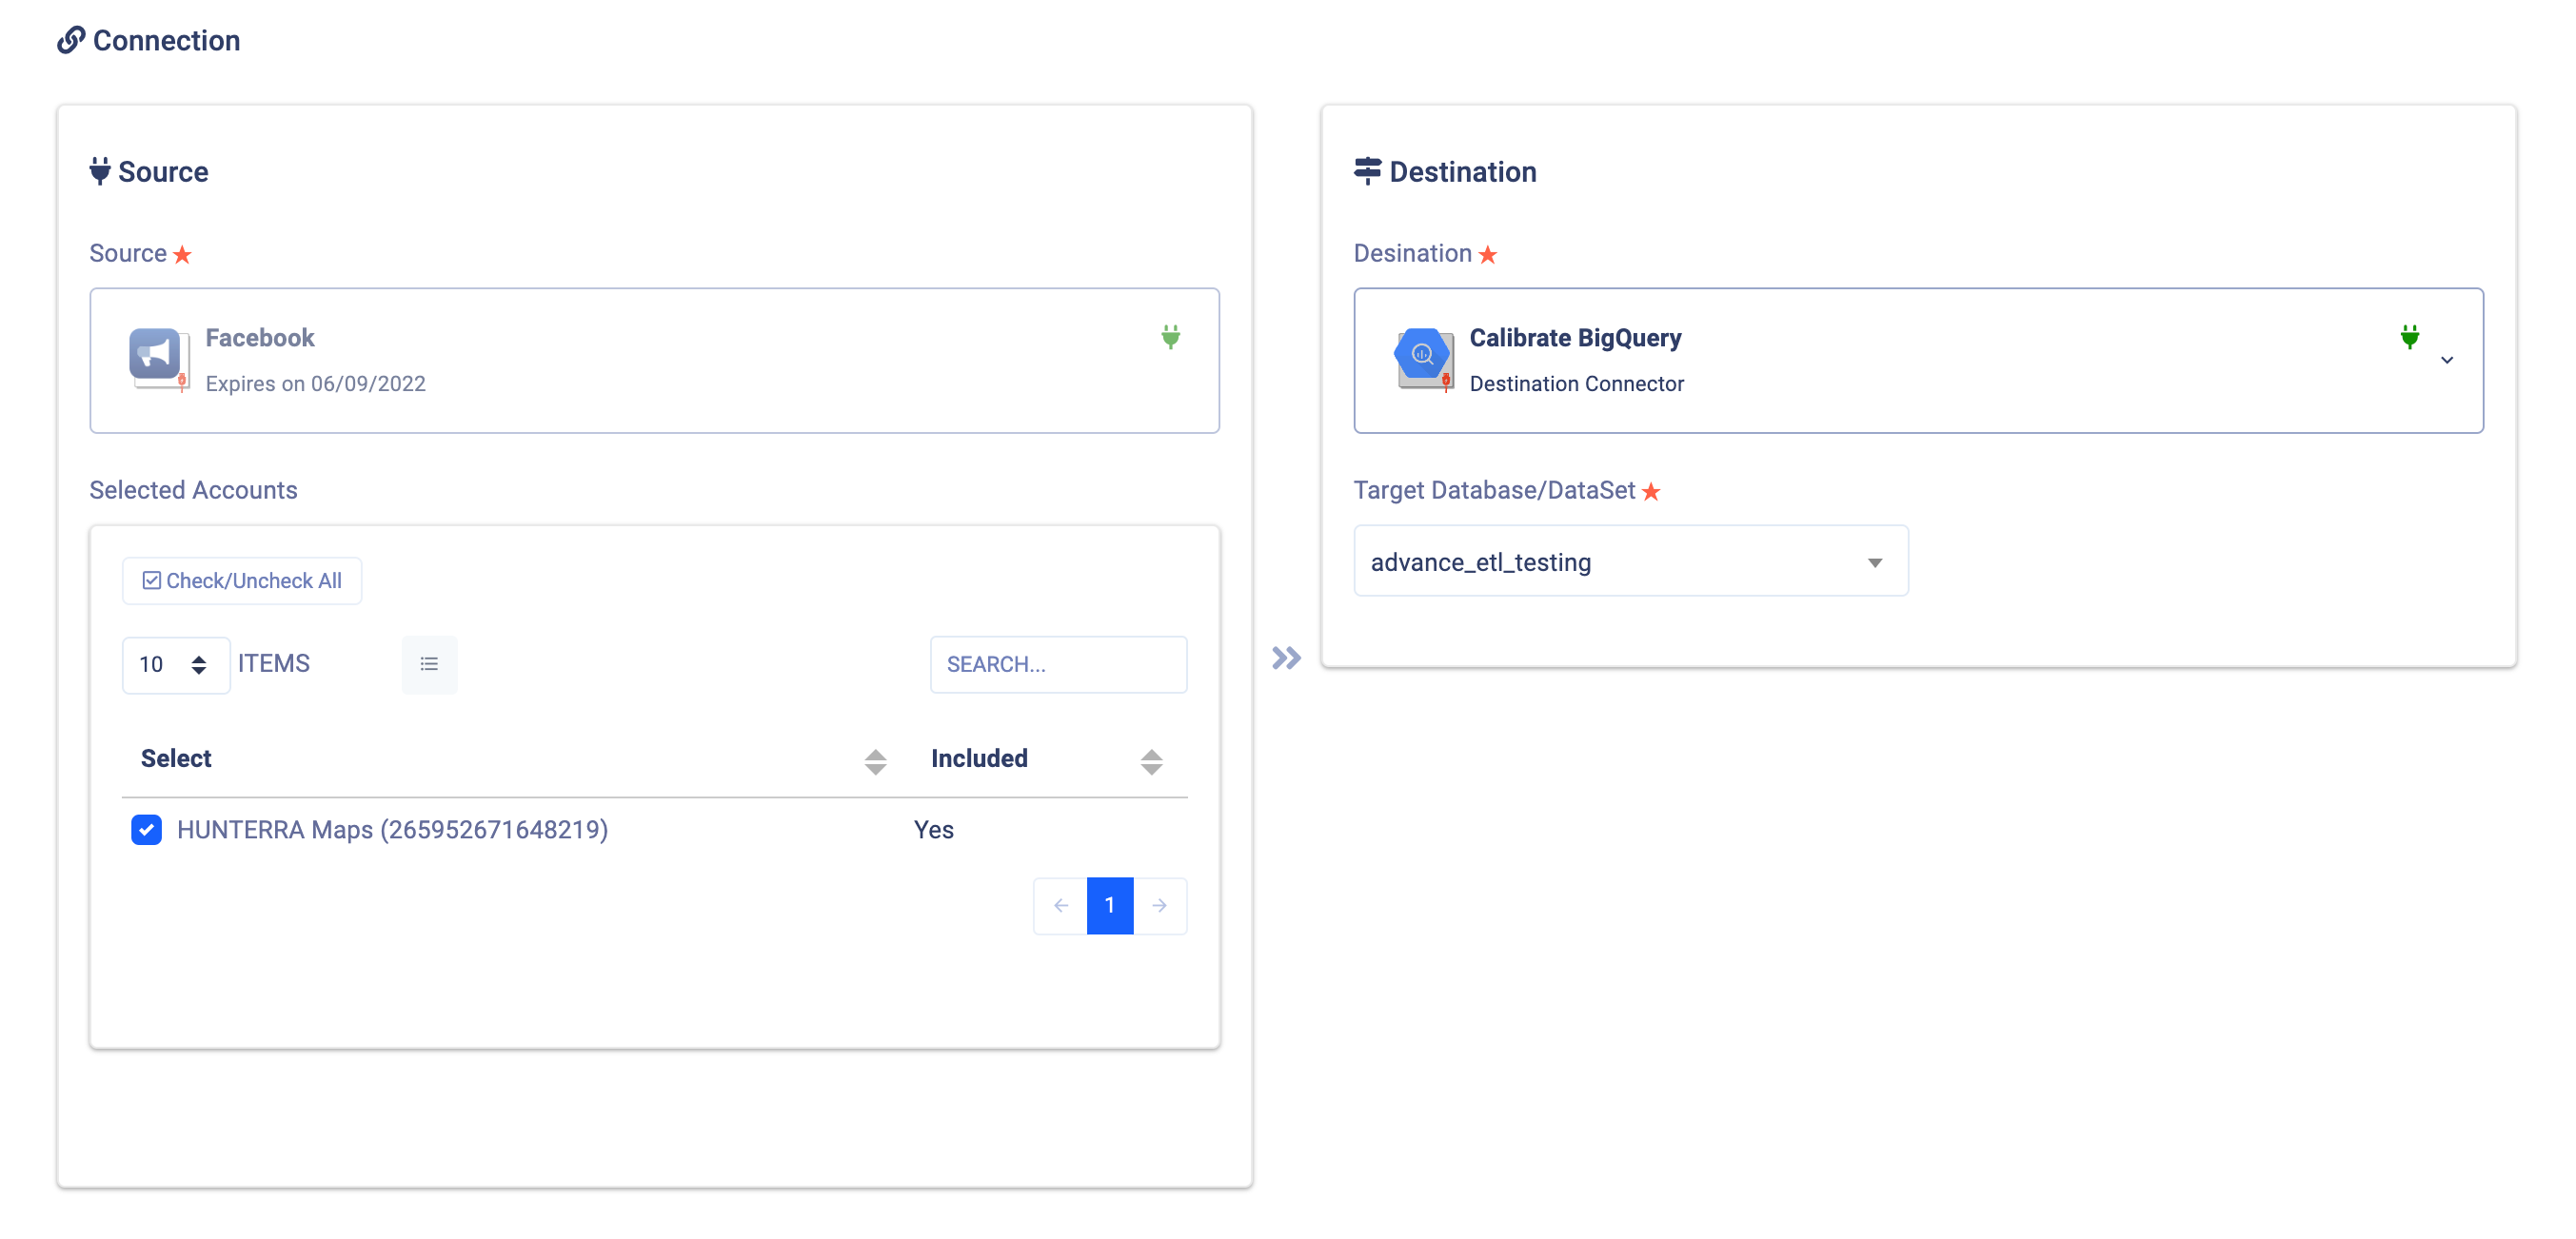
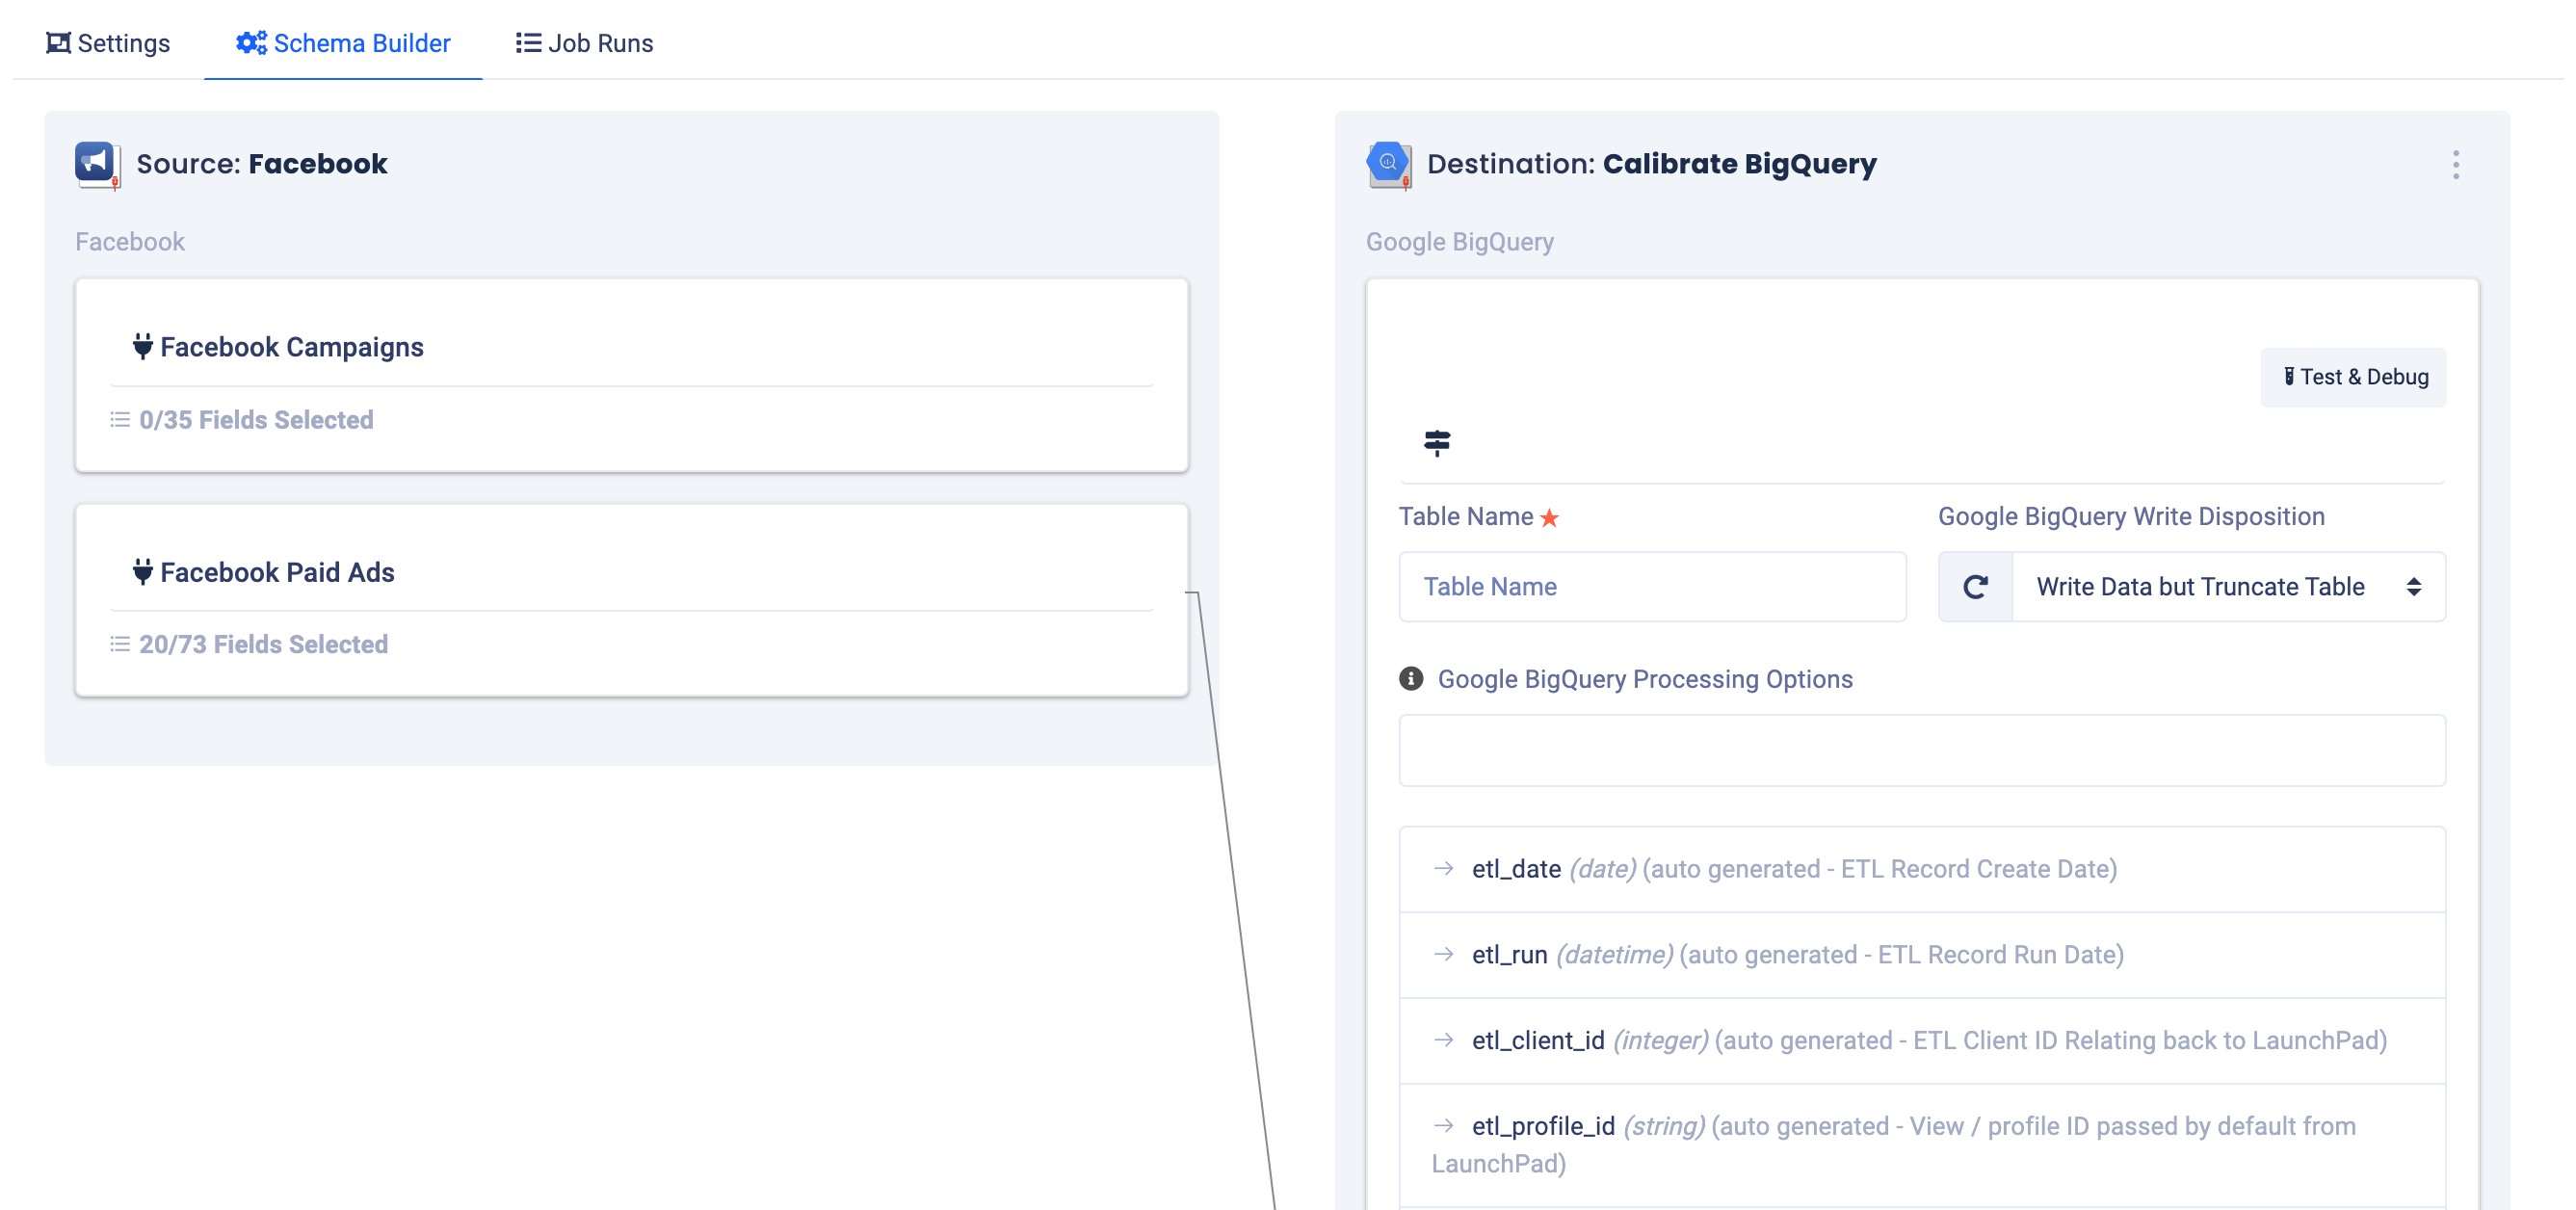
- Within your ETL, configure the desired data sources and destination (data storage)
- Next, connect the sources to your destination (data storage) and select the dimensions and metrics data that you would like to transfer to your BigQuery table
Transfer your data to Google BigQuery
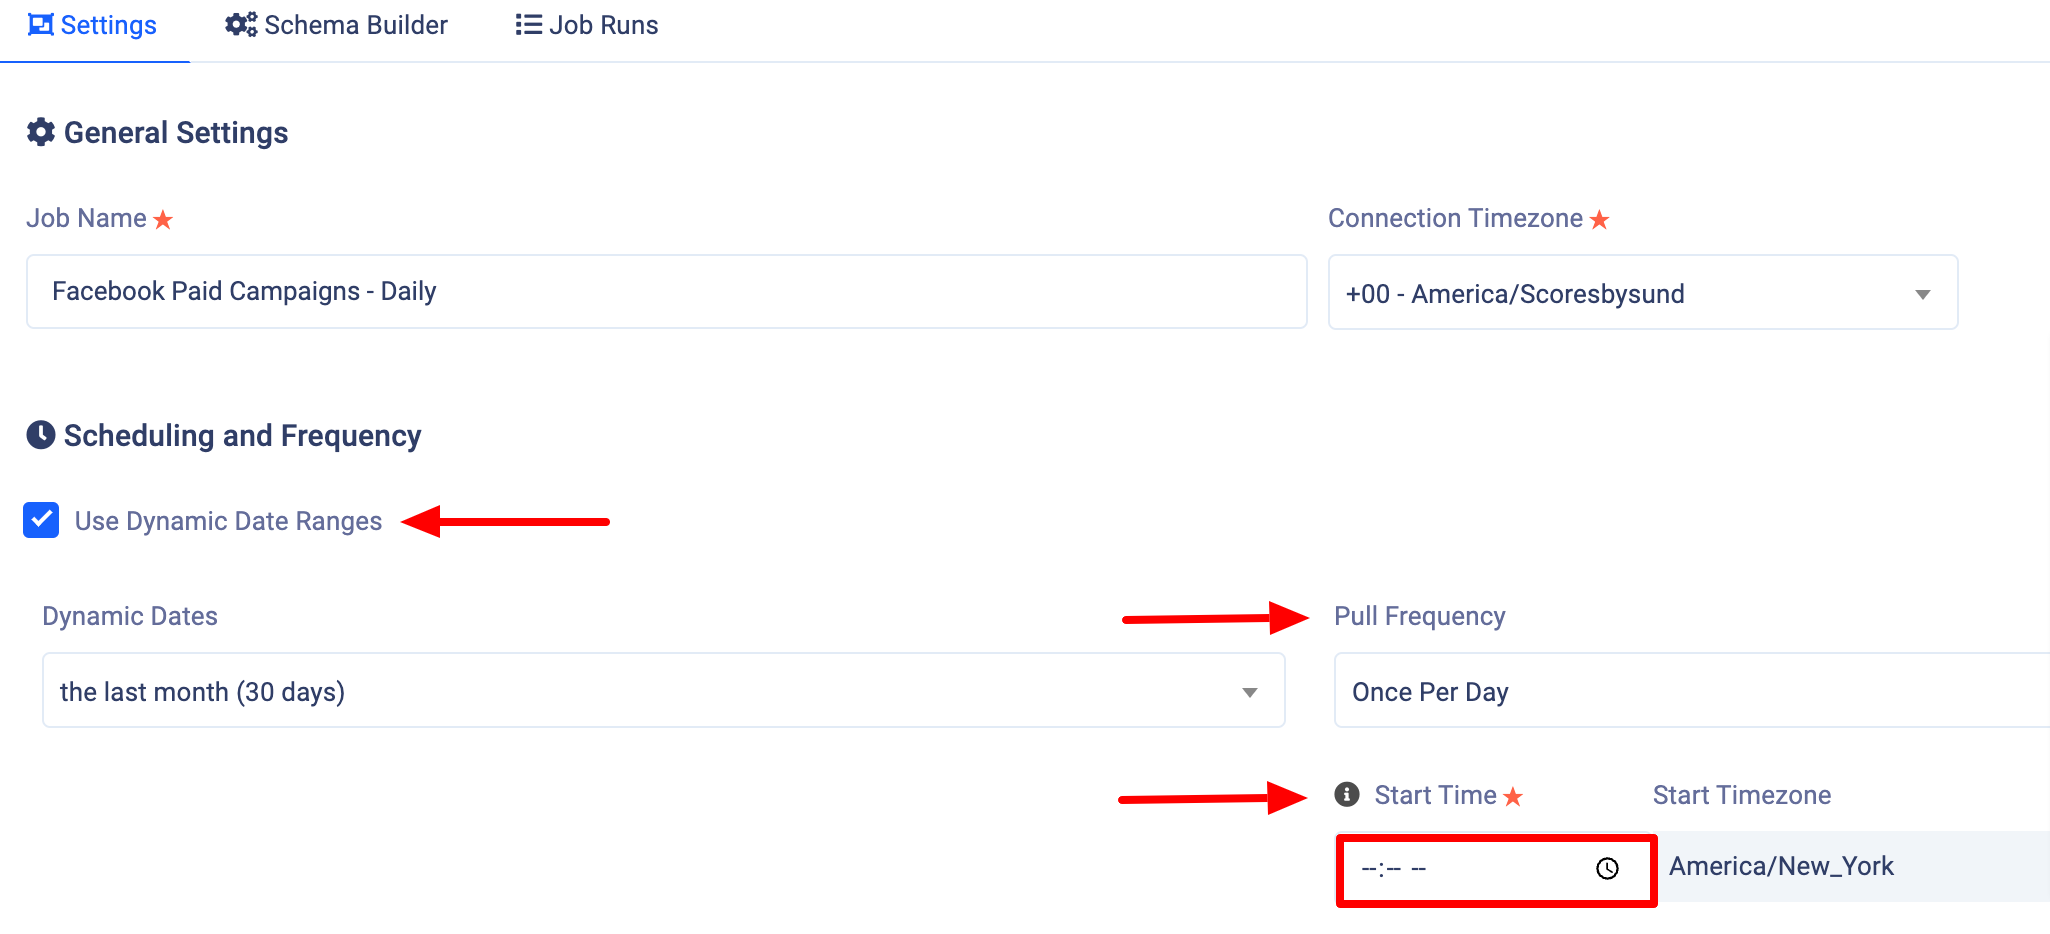
- Backfill to your desired start date for the data
- After you have backfilled the data you need, update the job settings to run the job each day (usually before you begin working). The end reports that use this data will refresh every day.
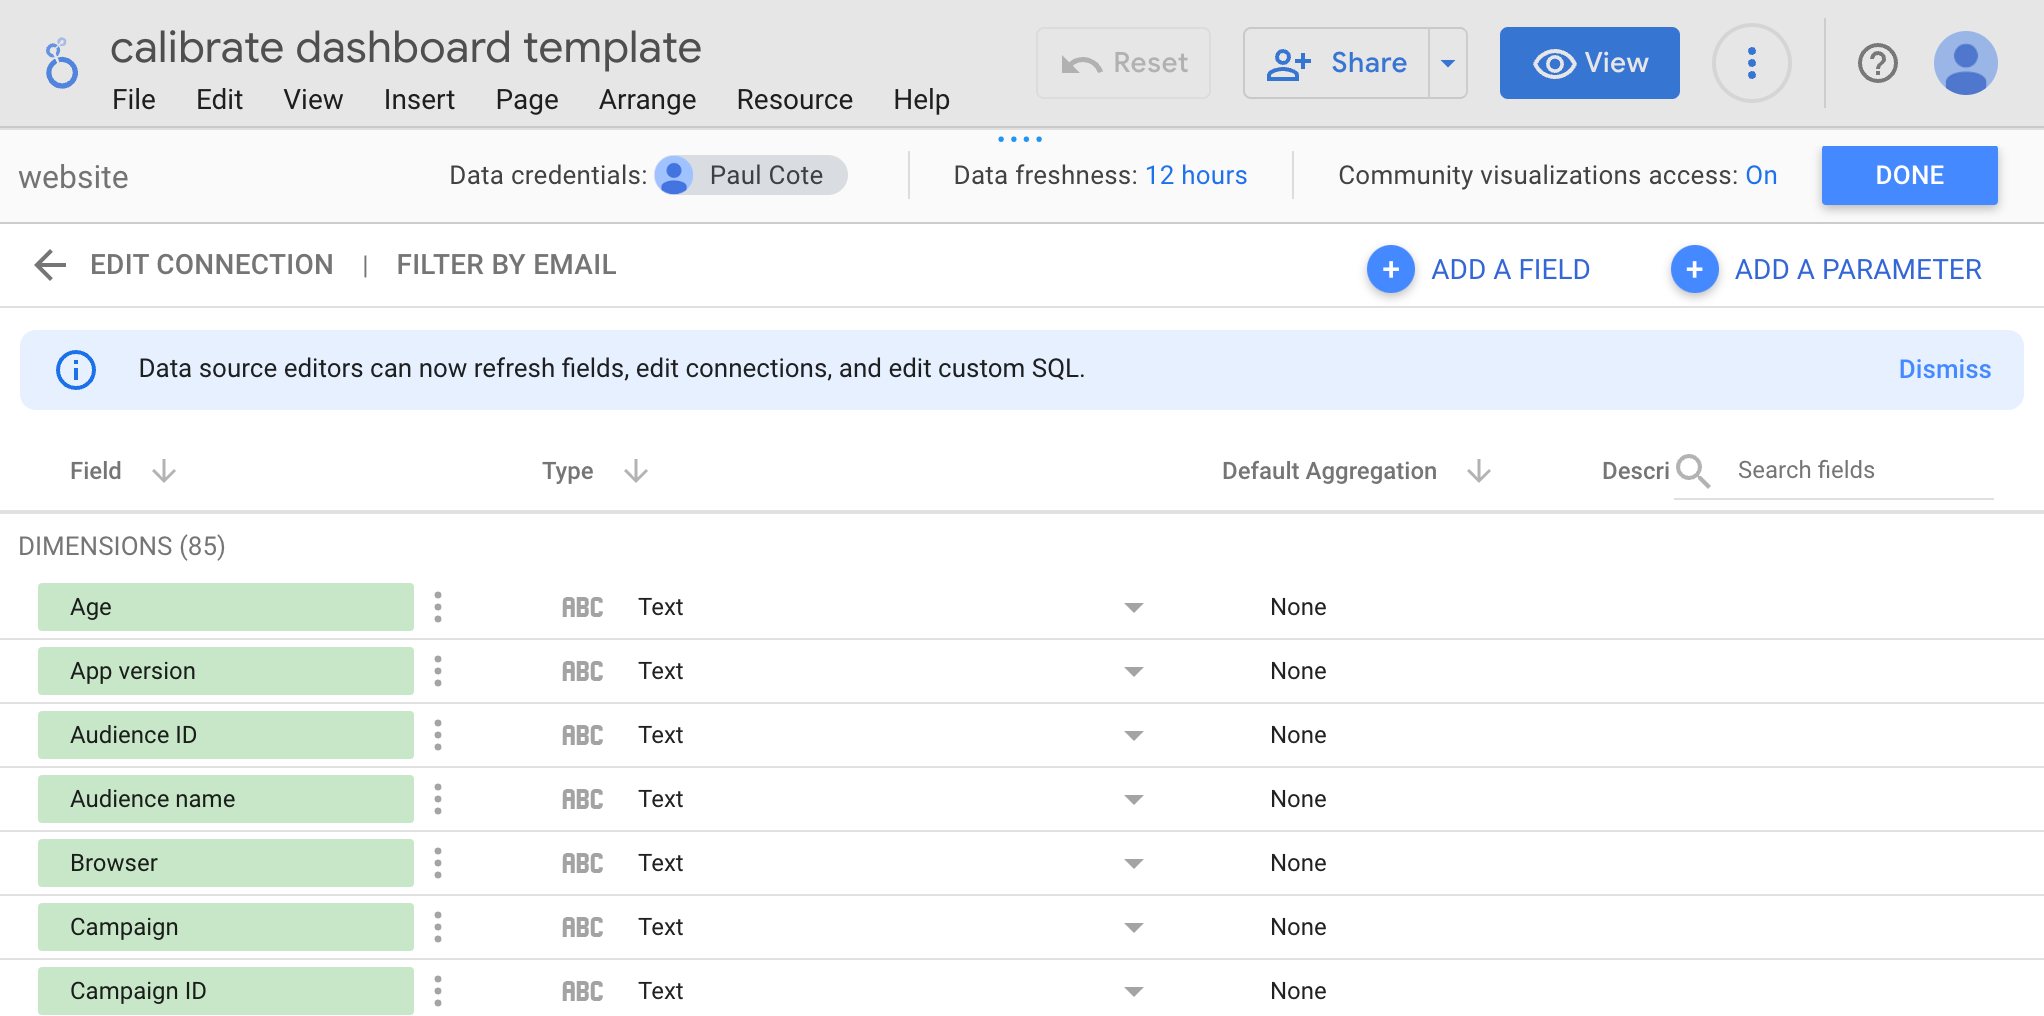
Connect Looker Studio to your table in BigQuery
- Log in to Looker Studio, click on the “Create” button in the top left, and click on "Data source"
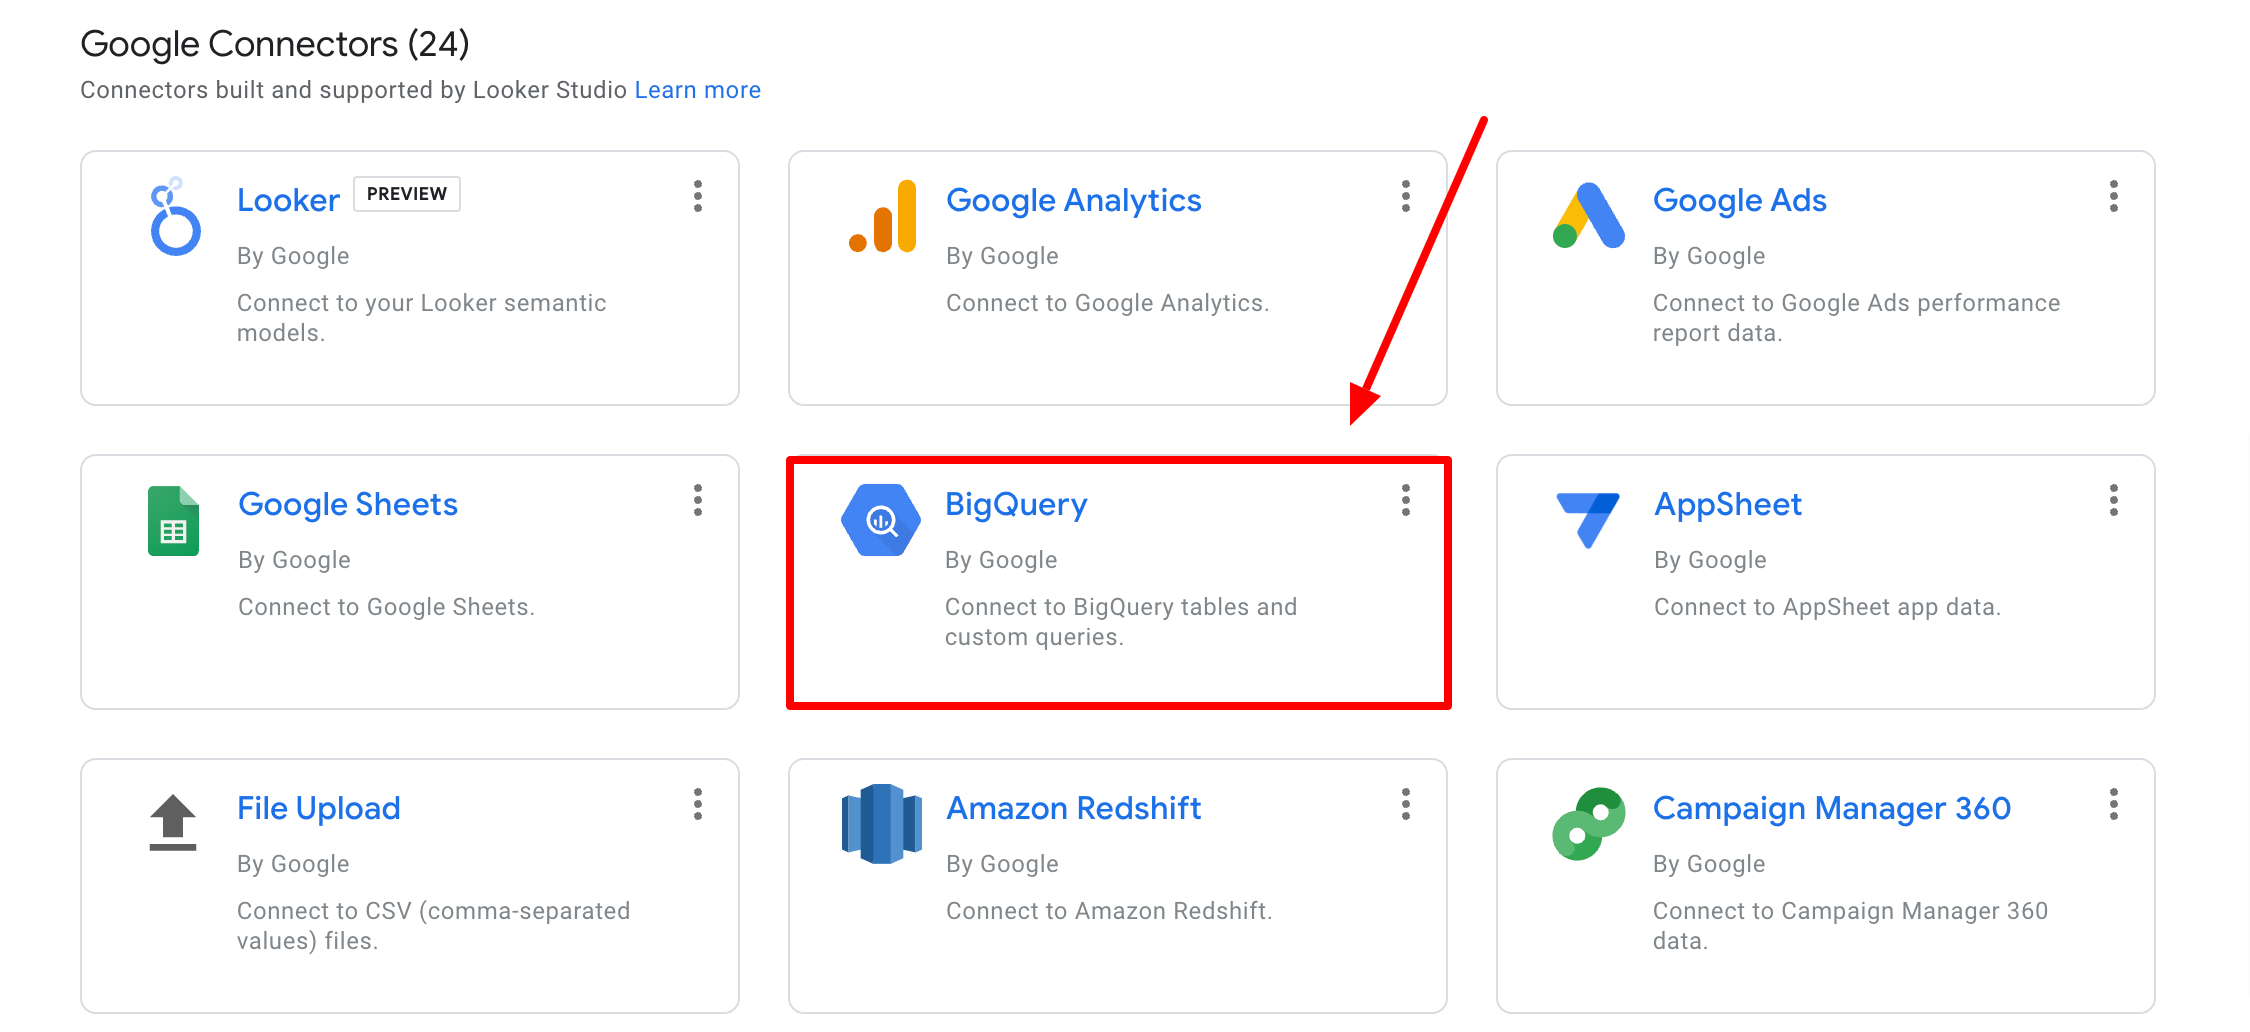
- Select Google BigQuery as your source
- Select the appropriate project where your datasets are stored
- Select the dataset that stores the target table
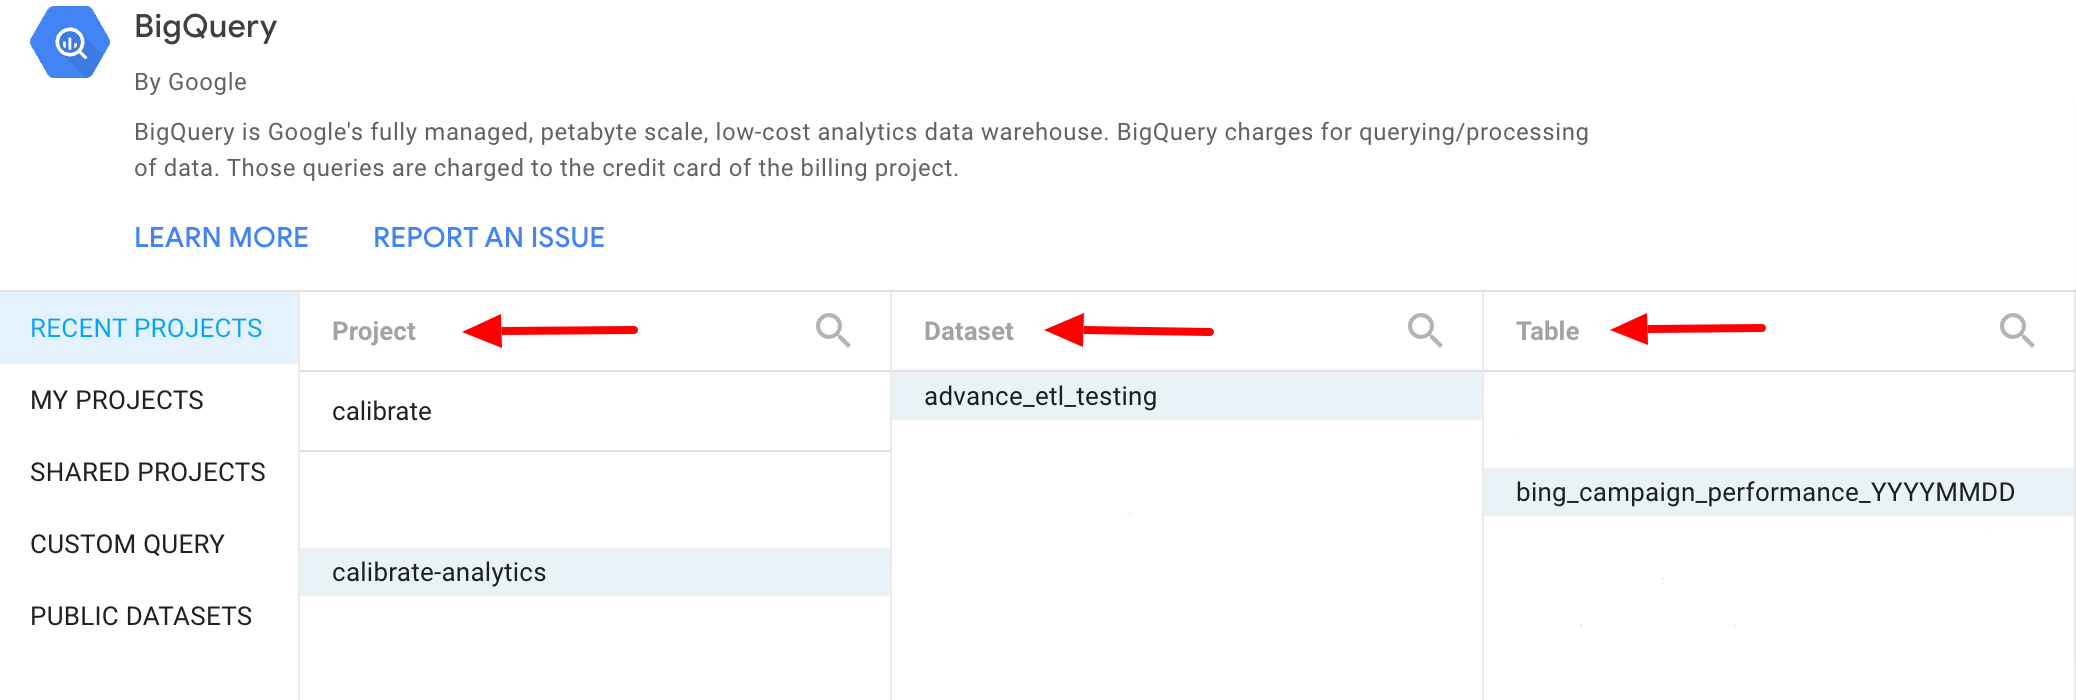
- Select the table and click "Save"
Connect your charts in Looker Studio to the new data source
Configure your new data source to match the the old source
- Rename dimensions and metrics (for consistent terminology)
- Recreate calculated fields
- Rebuild the blended table if necessary
- Select “Make a Copy” in the main menu
- When prompted, choose your new source in the copied version of the report
- Review the charts that are referencing the new source and verify that they are all working properly
You're done! Your reports will update each day at the time you've configured in Launchpad.
Need Help?
If you're having any trouble automating your reports, then the experts at Calibrate would be happy to help. From walk-throughs and interactive demos to custom solutions, we'll help you set up a healthy analytics stack that fuels smart business decisions.