If you or your team is managing the SEO (search-engine optimization) efforts for your own website or others, you've likely verified your site with Google and are looking at the Google Search Console performance reports on a regular basis. As long-time fans and users of the GSC dashboard, we decided to build a Launchpad integration with the goal of addressing one key issue we have with the existing report.
The performance reports in GSC (or API via Looker Studio) only allow users to view and analyze historical data from the previous 16 months. While 16 months should be enough history to monitor trends and build actionable plans to improve your visibility in organic search-engine results, it leaves you with a real challenge if you need to show improvement over the full life of the site and/or your SEO efforts. With the 16-month limitation, it's currently not possible to show a full year-over-year comparison using the native dashboard or with a direct API query via Looker Studio.
Launchpad uses the same API as everyone else, so it's not possible for it to pull data from earlier than GSC allows. But, if you begin pulling data today from the past 16 months and let Launchpad update your reports daily, you will begin to build a running history of your site's full performance. As each day passes, your database will extend further back, eventually stretching well past the previous 16 months.
Follow our four easy steps (no SQL necessary) to switch from the Looker Studio source with only 16 months of historic data to your own GSC performance database:
- Connect to the GSC API via Launchpad
- Transfer your data to a Google BigQuery account
- Connect Looker Studio to your table in Google BigQuery
- Connect your charts in Looker Studio to your new GSC data source
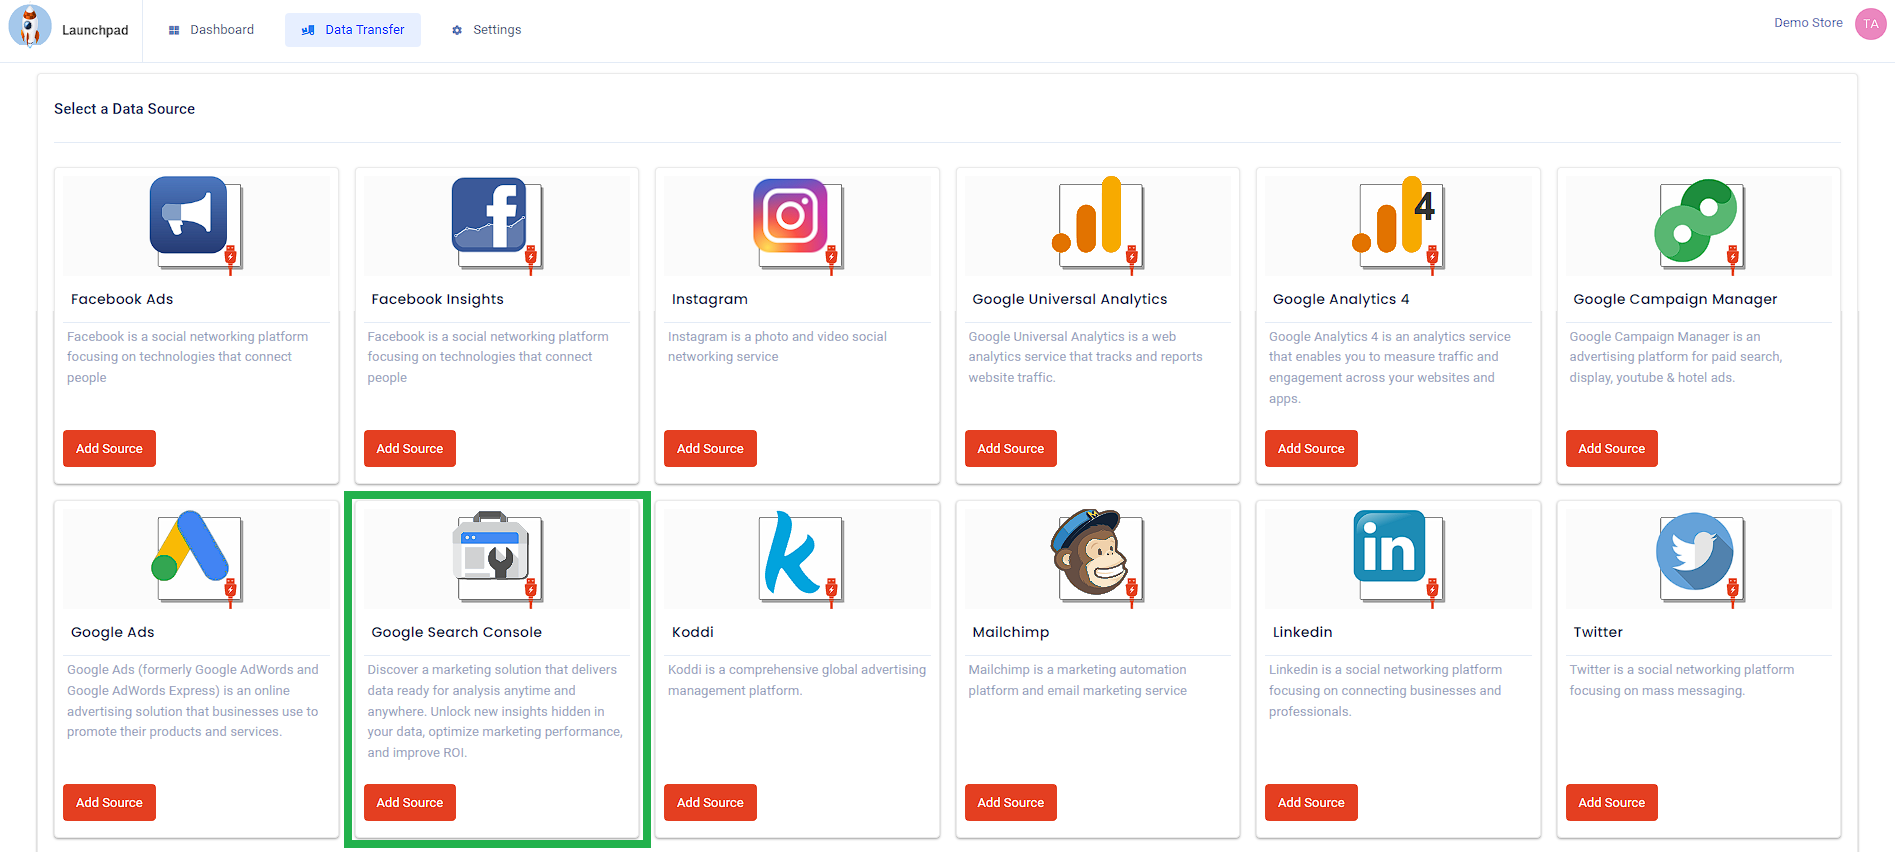
Connect to the GSC API via Launchpad
Log in to Launchpad and navigate to the source setup screen. Choose Google Search Console as your source and follow the instructions in the setup wizard.
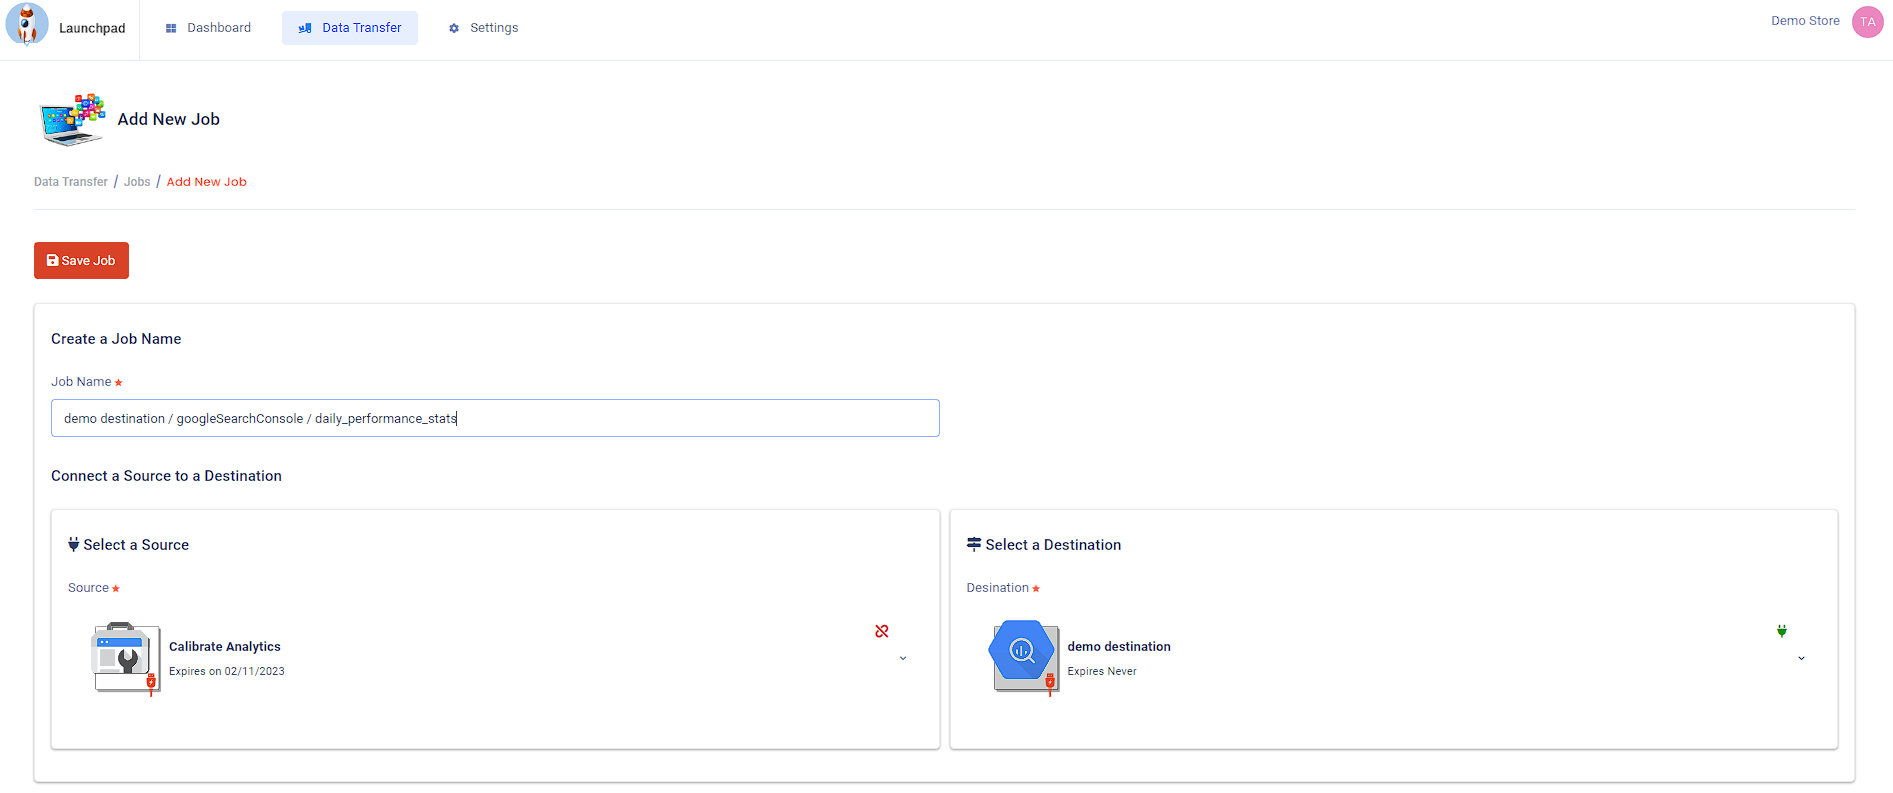
Transfer Your Data to a Google BigQuery Account
Connect your Google Search Console source to your Google BigQuery destination and configure your job settings and schema. We are using the following schema for our example:
Dimensions
- Country
- Device
- Query (search phrase)
Metrics
- Clicks
- Clicks
- Position
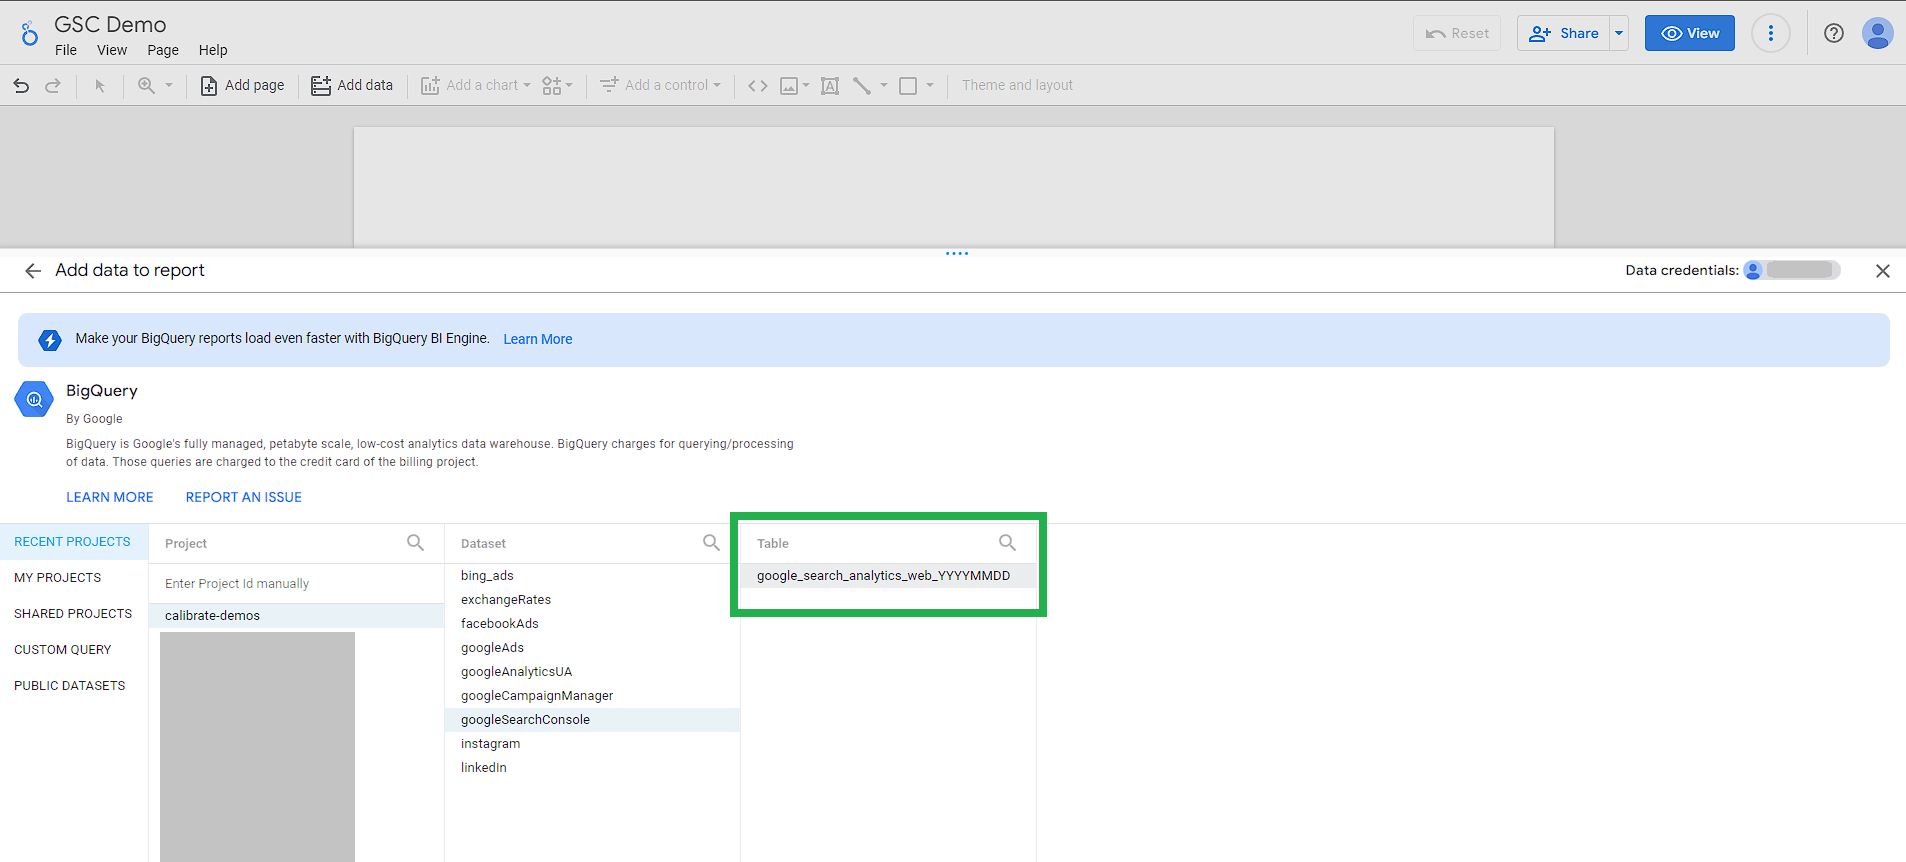
Connect Looker Studio to Your Table in Google BigQuery
Navigate to your report in Looker Studio and click on the "Add Data Option" in the menu. Choose Google BigQuery as your data source type and select your BQ project, dataset, and finally your GSC table. Click "Add" in the bottom right of the source setup screen.
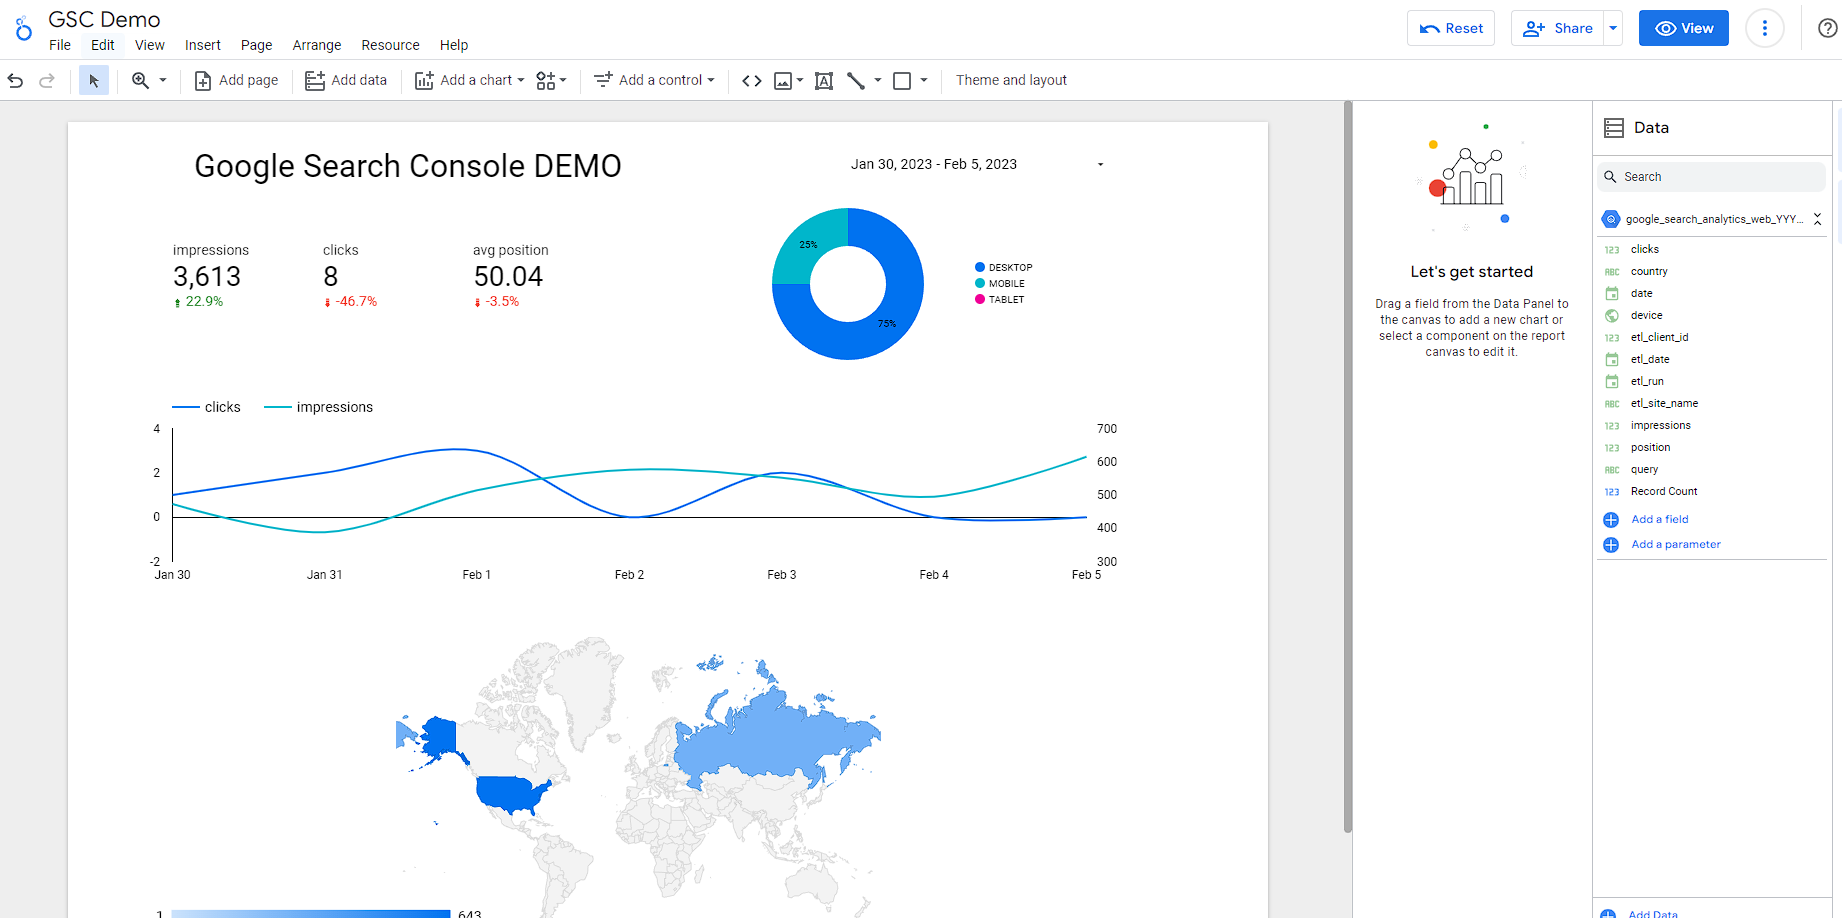
Connect Your Charts in Looker Studio to Your New GSC Data Source
You can now connect your charts to the new data source, and in eight short months, you'll be able to show two full years' worth of historic GSC performance data to your stakeholders.
IMPORTANT:
After you have done the initial 16-month backfill of your data, you'll need to set a schedule in your Launchpad job to run at a desired time each day (usually before your workday begins). We suggest you refresh the previous seven days' worth of data (instead of daily) because Google notes in their documentation that the initial data in the report is "preliminary," and it could change for up to three days.
Easter Egg!
Congratulations — you made it to the end of our GSC post and discovered a SQL easter egg. While there's no SQL necessary to connect Looker Studio to the table that Launchpad writes to your BQ dataset, you may find the following query useful in your journey:
    SELECT
        etl_date AS date,
        query AS keyword,
        country,
        position,
        LOWER(device) AS device,
        SUM(clicks) AS clicks,
        SUM(impressions) AS impressions

    FROM `your-project-id.your-dataset-name.your-table-name_20*`

    GROUP BY
        date,
        keyword,
        country,
        position,
        device

    ORDER BY
        date desc
How Can We Help?
If you're having any trouble managing your data, then the experts at Calibrate would be happy to help show you what's possible. From walk-throughs and interactive demos to custom solutions, we'll help you set up a healthy analytics stack that fuels smart business decisions.