Calibrate Analytics was created by seasoned digital marketers with more than 50 years of combined experience. Much of what we do today is sharing solutions to problems we have solved throughout our careers, and we always try to steer our product roadmap towards enhancements that help the digital marketing community spend more time being creative and focused on driving results, and less time on repetitive tasks that applications can do.
One of my first reporting automation projects was to help my team generate Search Engine Marketing reports. The goals of the project were to reduce the absorbent amount of time the team needed to spend to prepare the report each month, and to change from a monthly refreshed report to a daily refreshed report. At the time, we were not using the platform conversion pixels to measure performance, rather we would use Google Analytics to ensure transactions were not being double counted across Google and Bing and the customer would see the same results when looking directly at their Google Analytics report.
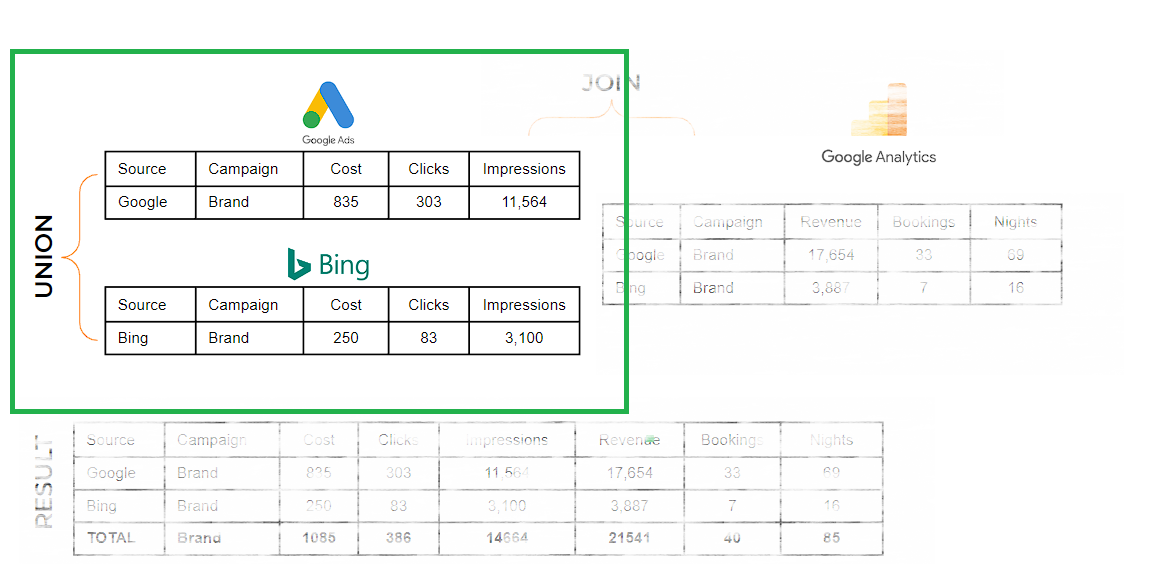
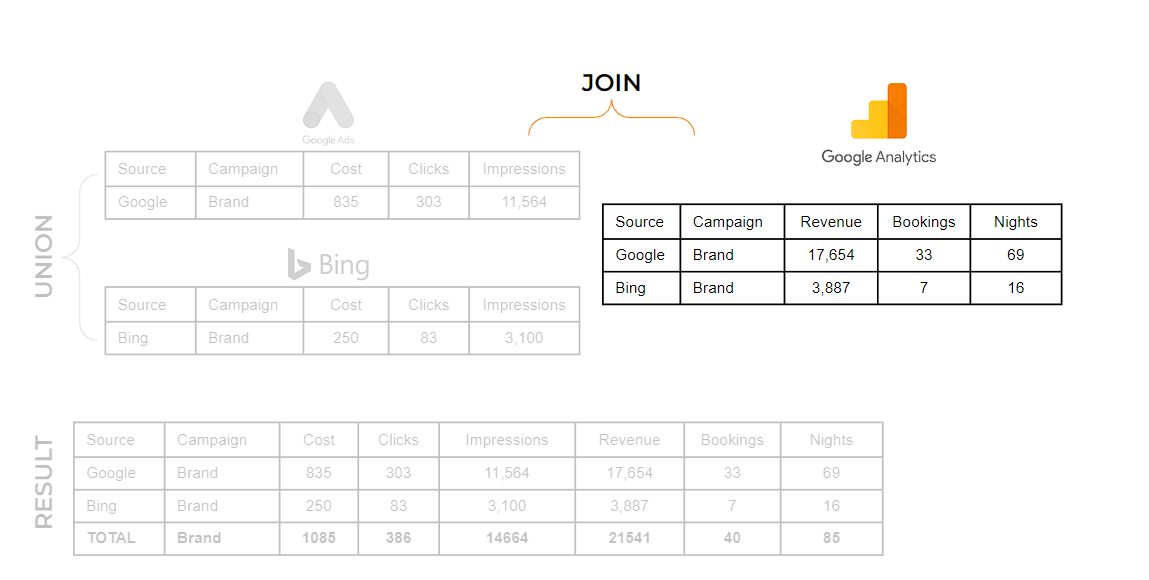
Here is a visual representation of the data sources as well as the transformations we'll use to produce the RESULT table.
Here are the steps to build my first automated Search Engine Marketing report using an ETL, such as Launchpad, Google BigQuery and Google Looker Studio. While the tools have certainly advanced over the years, the process hasn't changed all that much.
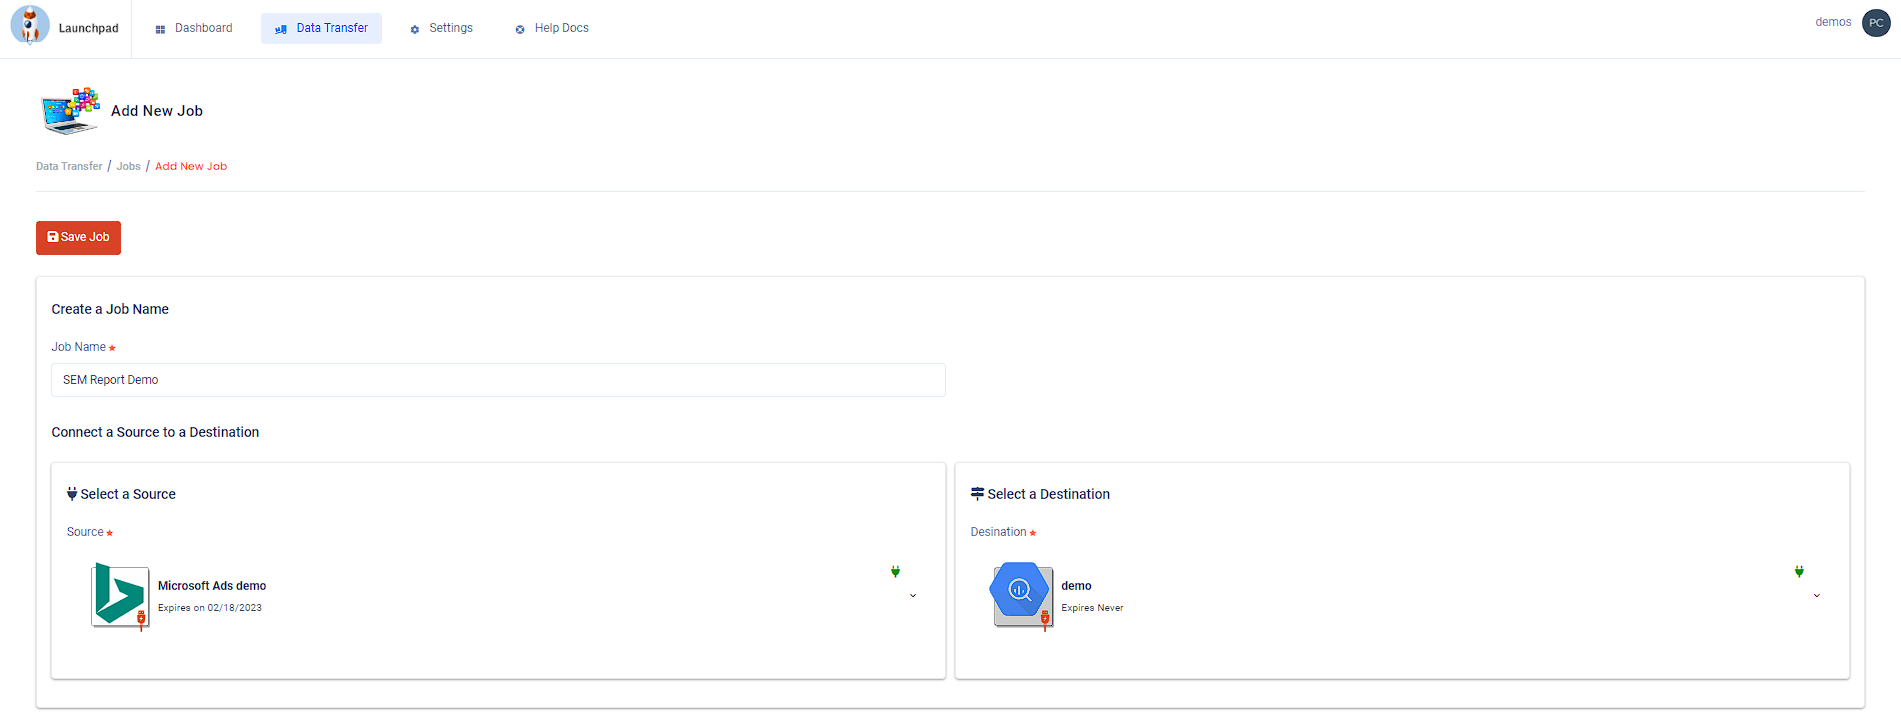
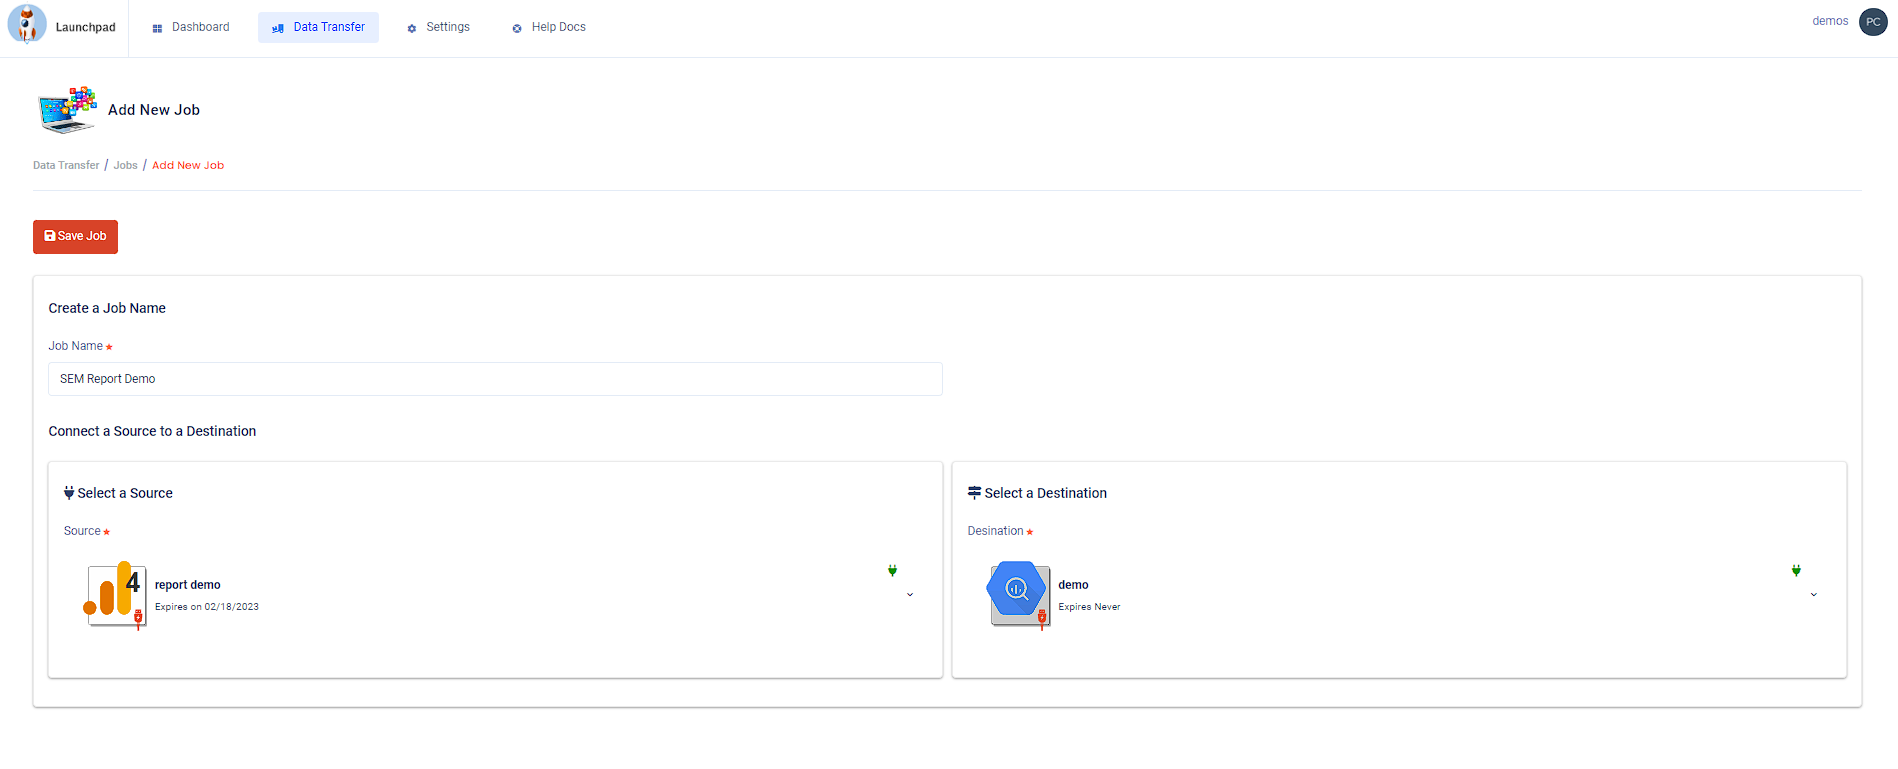
1. Connect data sources
Connect to your data sources and destinations with an ETL has integrations to the following:
Source integrations you'll need are
- Google Ads
- Microsoft Ads
- Google Analytics
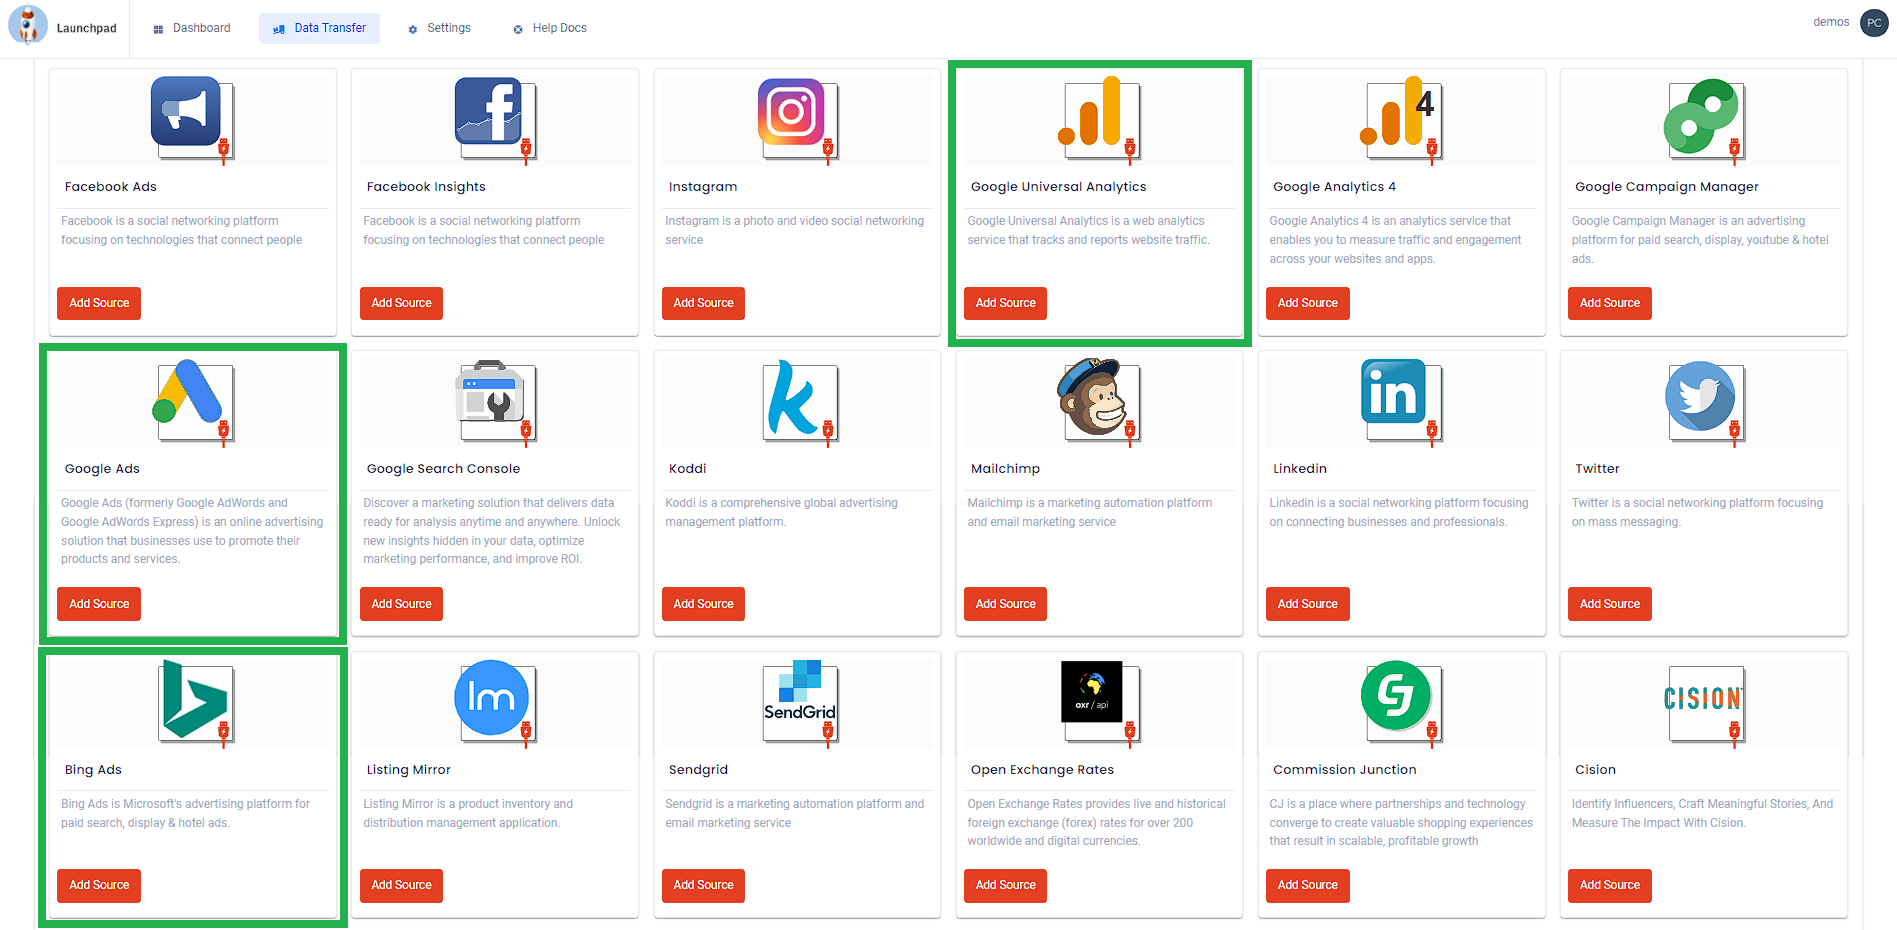
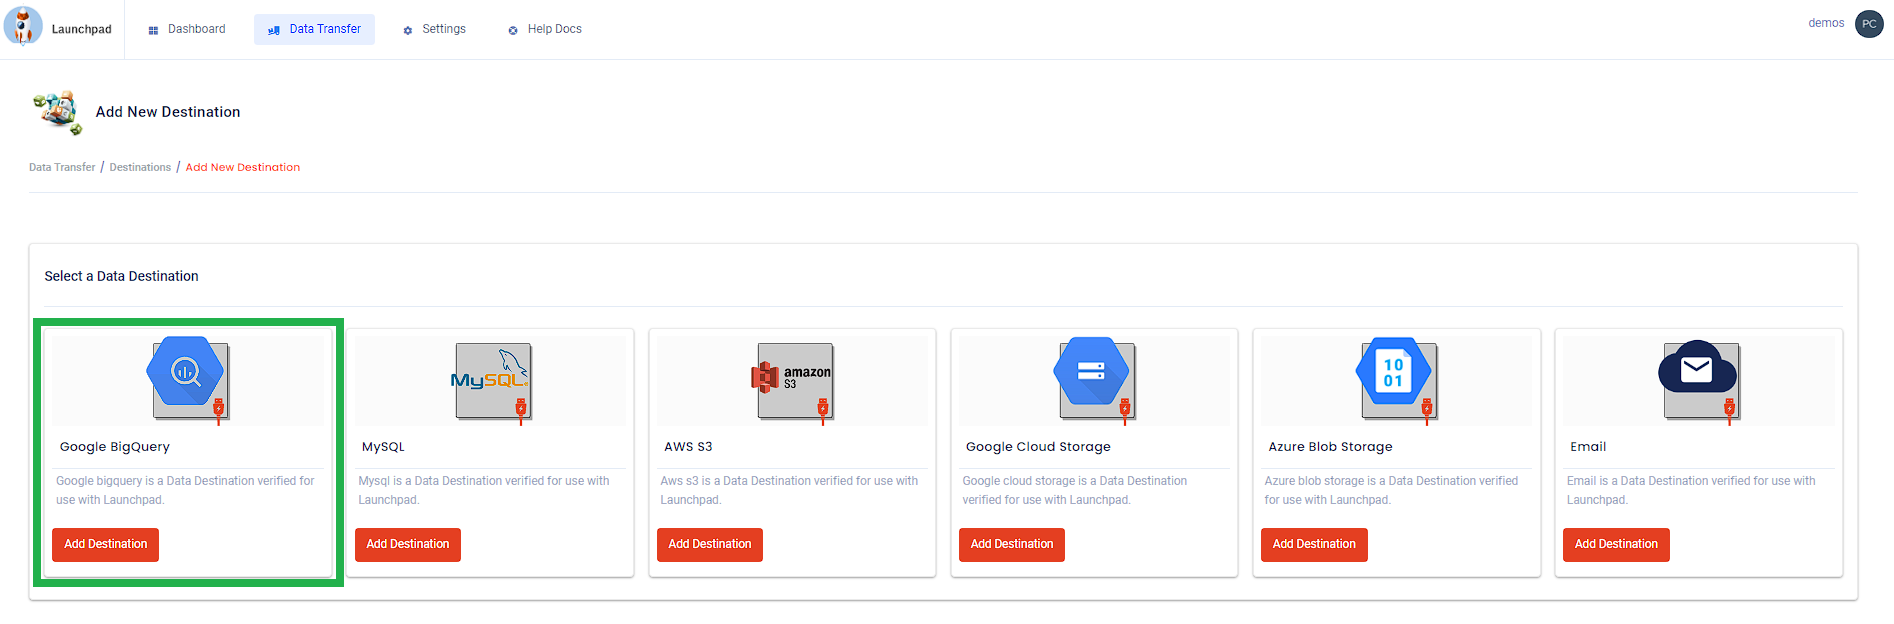
Destination integrations you'll need are
- Google BigQuery
2. Create datasets
Create a separate dataset for each data sources in BigQuery
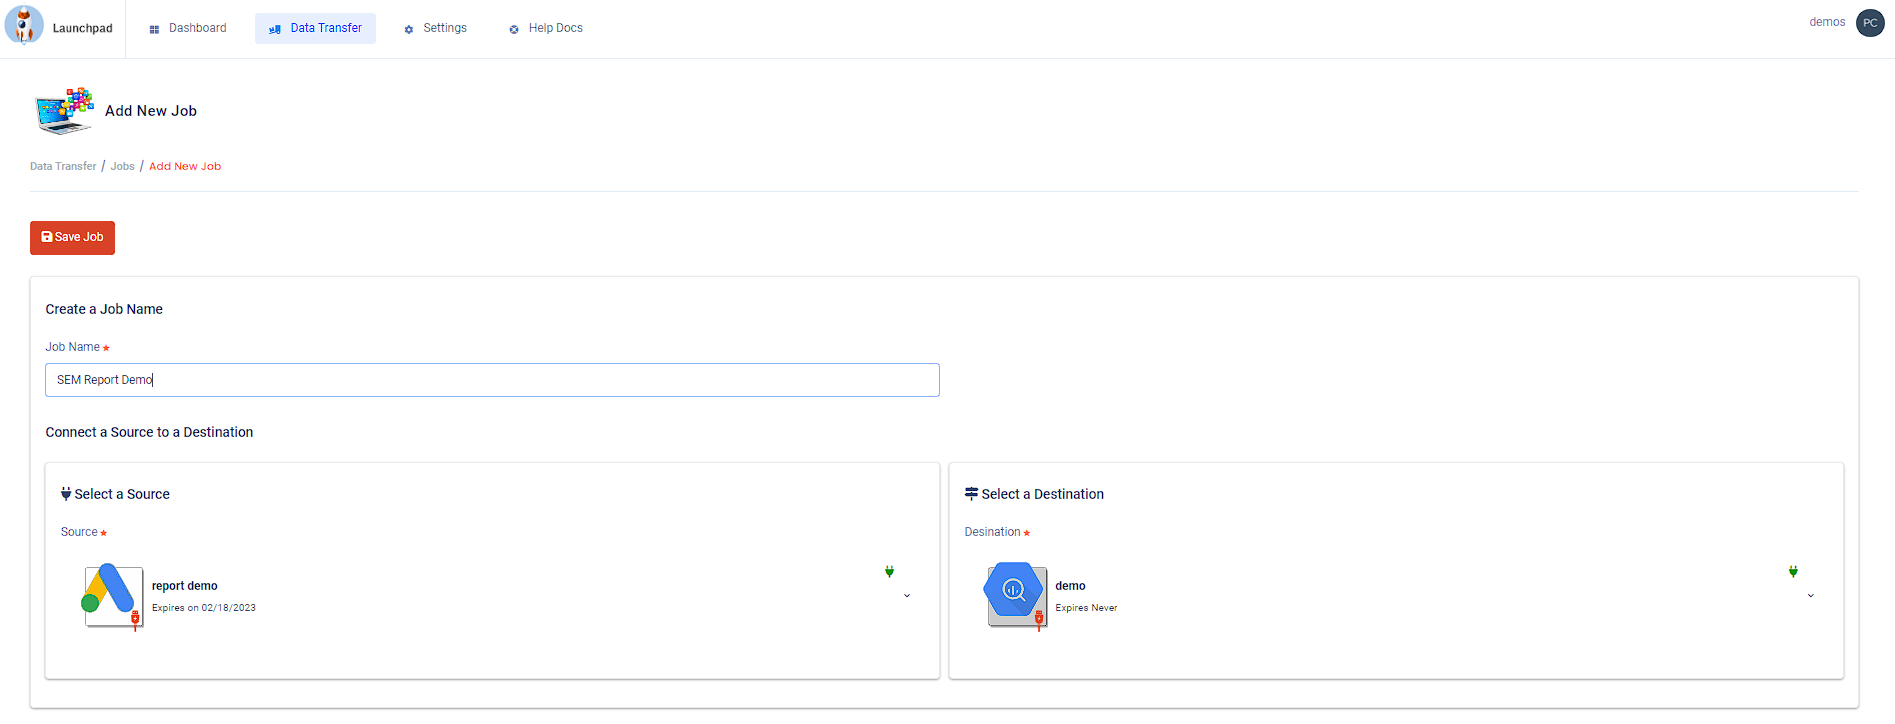
3. Configure data transfers
Configure jobs and transfer data using the following schemas to the corresponding dataset in Google BigQuery:
Google Ads:
- Dimensions
- date
- campaign_id
- campaign_name
- Metrics
- cost
- clicks
- impressions
Microsoft Ads:
- Dimensions
- date
- campaign_id
- campaign_name
- Metrics
- cost
- clicks
- impressions
Google Analytics 4:
- Dimensions
- date
- traffic.source
- campaign
- Metrics
- transactions
- revenue
- quantity
4. Summarize data
In Google BigQuery you need to summarize your Google and Bing campaign data and UNION with the following query:
    SELECT
        etl_date AS date,
        'google' AS source,
        c_name AS campaign_name,
        SUM(m_cost_micros) / 1000000 AS cost,
        SUM(m_clicks) AS clicks,
        SUM(m_impressions) AS impressions

    FROM `your-project-id.your-dataset.your-google-ads-table_202*`

    GROUP BY
        date,
        campaign_name

    UNION ALL

    SELECT
        etl_date AS date,
        'bing' AS source,
        CampaignName AS campaign_name,
        SUM(Spend) AS cost,
        SUM(Clicks) AS clicks,
        SUM(Impressions) AS impressions

    FROM `your-project-id.your-dataset.your-microsoft-ads-table_202*`

    GROUP BY
        date,
        campaign_name

    ORDER BY
        date desc
5. Choose save as view
name: sem_campaign_stats
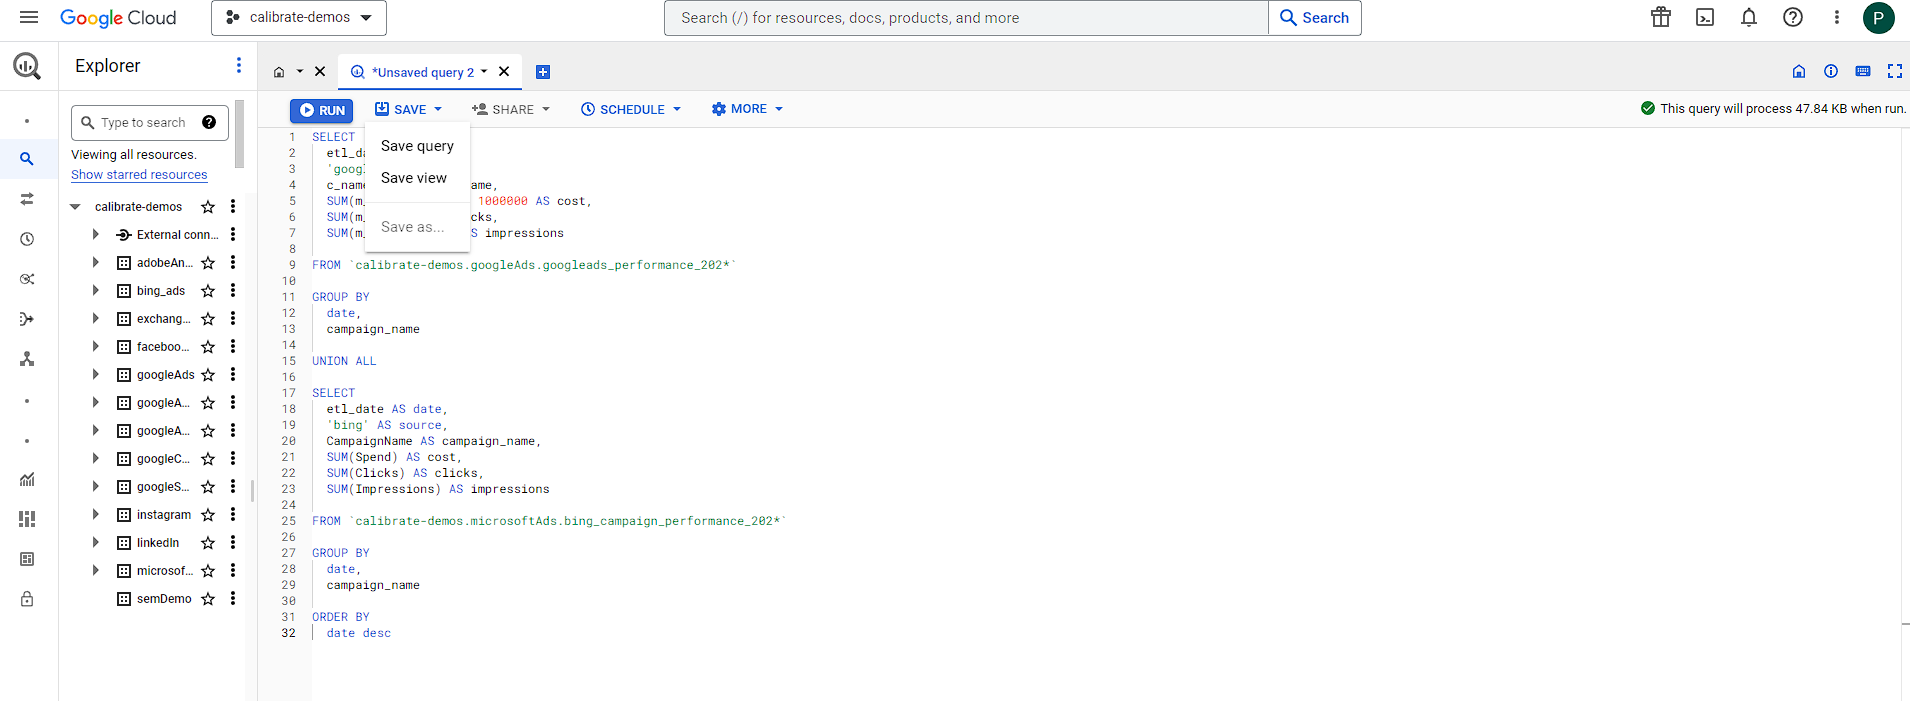
You have now completed the UNION aspect of the project:
6. Conversion data
Summarize your GA 4 conversion data with the following query:
- Save as a view
- Name your view: sem_conversion_stats
    SELECT
        etl_date AS date,
        source,
        campaignName AS campaign_name,
        COUNT(DISTINCT transactionId) AS transactions,
        SUM(totalRevenue) AS revenue

    FROM `your-project-id.your-dataset.your-google-analytics-4-table_202*`

    WHERE medium = 'cpc' AND (source = 'google' OR source = 'bing')

    GROUP BY
        date,
        source,
        campaign_name
7. Join campaign data
Join campaign data with conversion data views using the following query:
    SELECT
        campaign.date,
        campaign.source,
        campaign.campaign_name,
        campaign.clicks,
        campaign.impressions,
        campaign.cost,
        conversion.transactions,
        conversion.revenue

    FROM `your-project-id.your-dataset.sem_campaign_stats` AS campaign

    LEFT JOIN `calibrate-demos.your-dataset.sem_conversion_stats` AS conversion

    ON campaign.date = conversion.date
          AND campaign.source = conversion.source
          AND campaign.campaign_name = conversion.campaign_name

    ORDER BY
       date desc
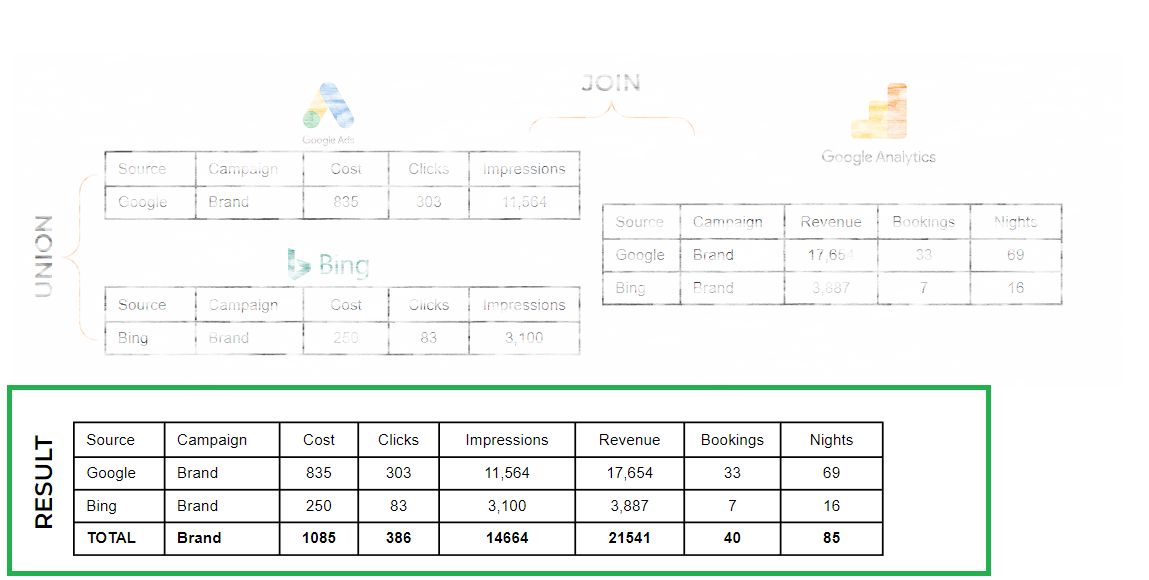
You have now completed the JOIN aspect of the project:
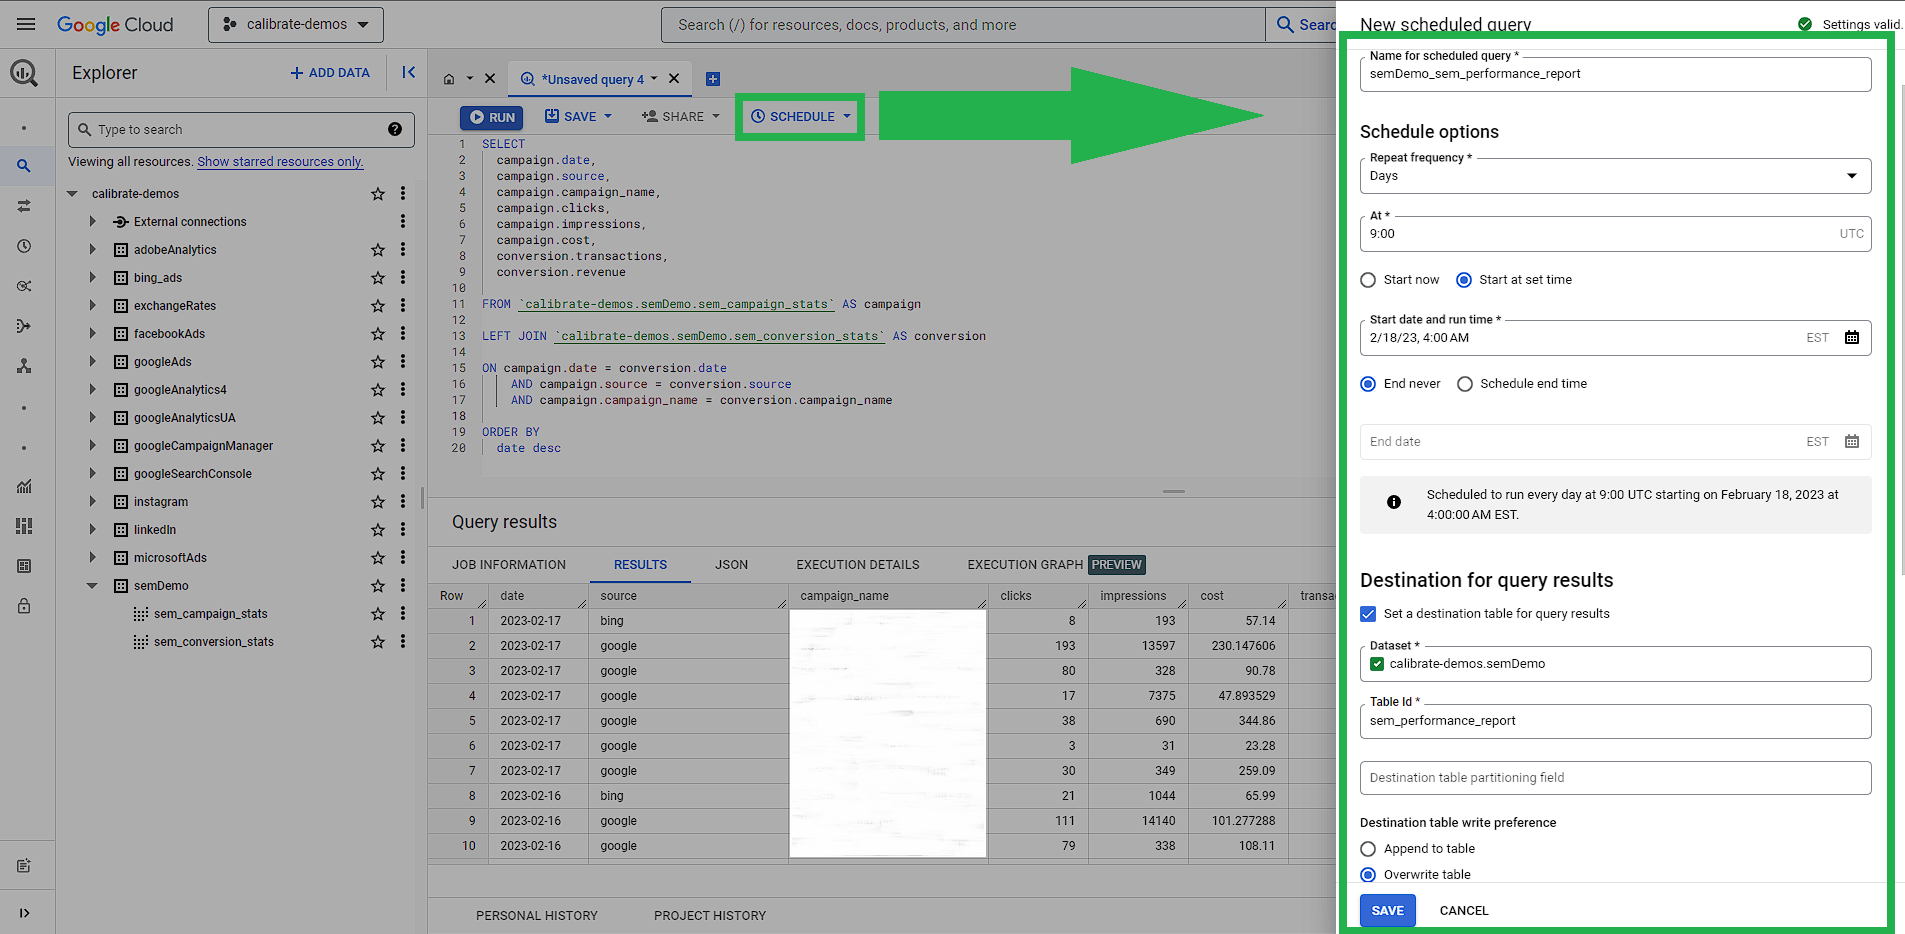
8. Save scheduled query
The last query should NOT be saved as a view. Click on Schedule -> create new scheduled query. Configure a scheduled query in Google BigQuery to run the query each day before you begin working and either overwrite the original table. The output of the scheduled query will be your final reporting table that your dashboard app will connect to.
You have now completed the transformation and have a flat table:
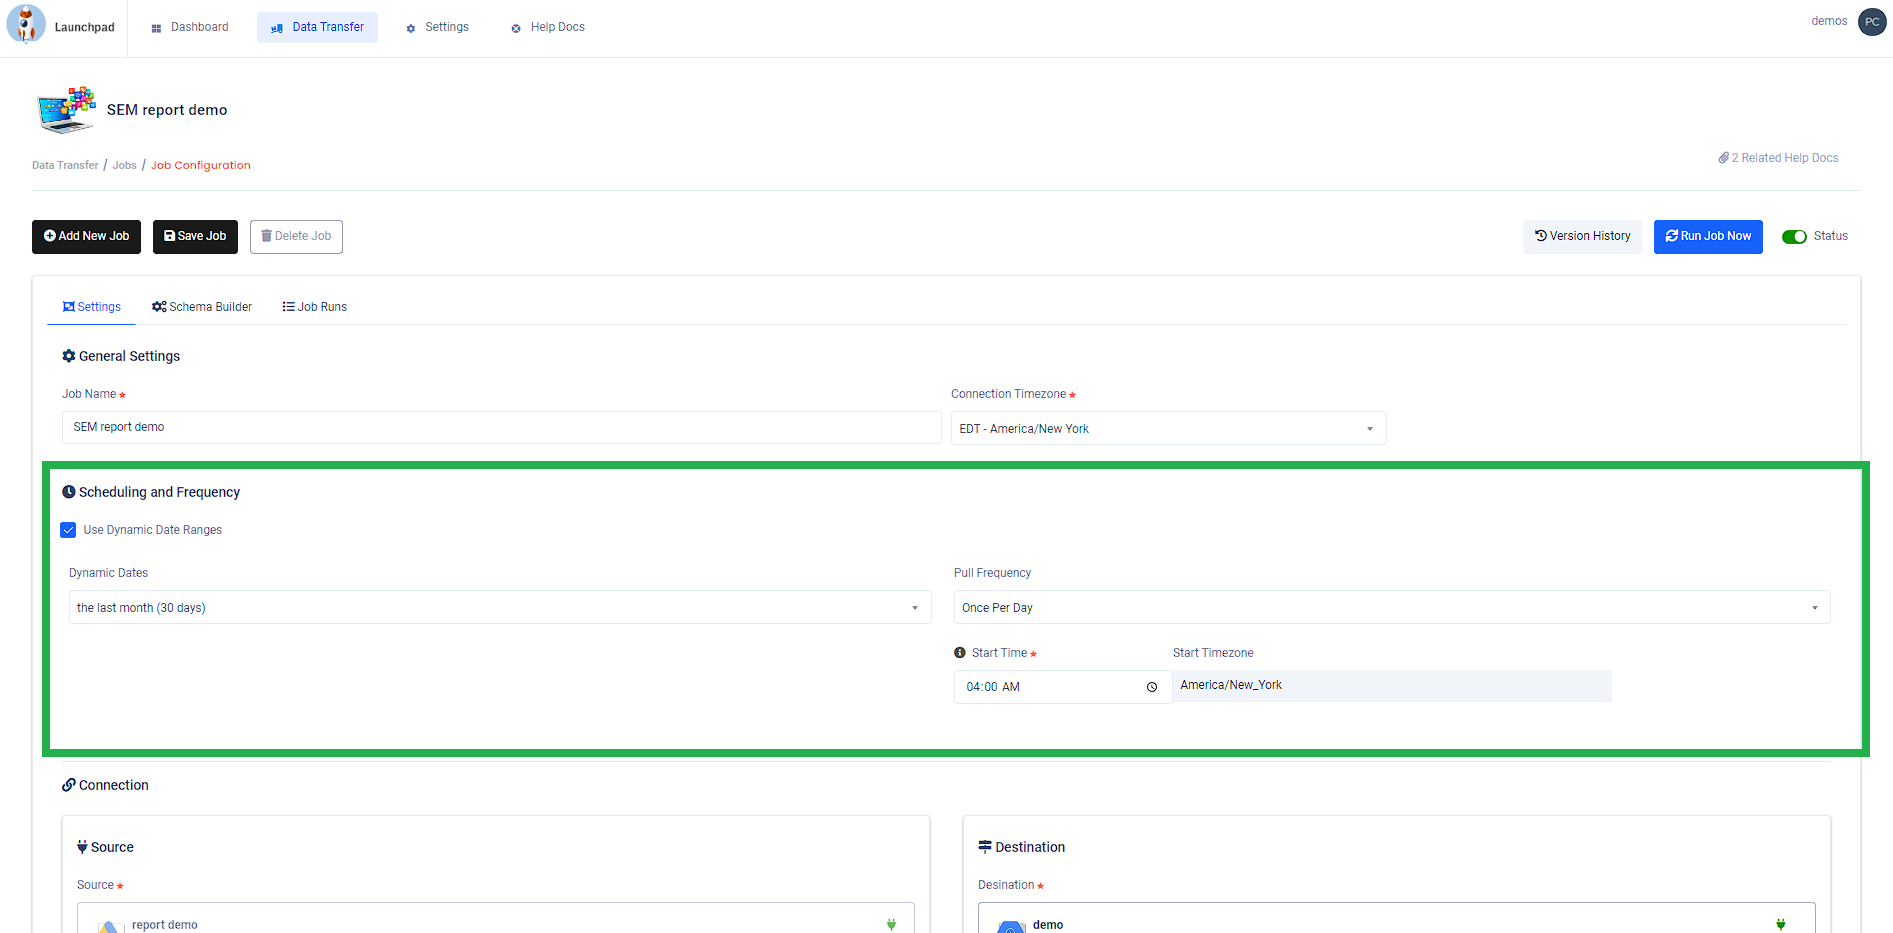
9. Schedule jobs to run
Schedule Launchpad to run your jobs each day before your scheduled query in Google BigQuery is set to run (this ensures the new data has been loaded to the DB before your final table is updated)
10. Connect a visualization app
Connect a visualization app like Looker Studio, Microsoft Power Bi or any other that has a native connector to BigQuery
Now you can drop the manual data entry tasks and spend your days visualizing, analyzing, testing and strategizing.
Bonus SQL Example
Congratulations, you've made it through our post. As mentioned above, we broke out the various SQL elements to help you to better understand the various components. It is possible to do all of these transformations in one query, so we've included an example of how you might do that as well. Use the following query to combine steps 4 - 6 and replace the existing SQL in your scheduled query.
        WITH sem_campaign_stats AS (

            SELECT
                etl_date AS date,
                'google' AS source,
                c_name AS campaign_name,
                SUM(m_cost_micros) / 1000000 AS cost,
                SUM(m_clicks) AS clicks,
                SUM(m_impressions) AS impressions

            FROM `your-project-id.your-dataset.your-google-ads-table_202*`

            GROUP BY
                date,
                campaign_name

            UNION ALL

            SELECT
                etl_date AS date,
                'bing' AS source,
                CampaignName AS campaign_name,
                SUM(Spend) AS cost,
                SUM(Clicks) AS clicks,
                SUM(Impressions) AS impressions

            FROM `your-project-id.your-dataset.your-microsoft-ads-table_202*`

            GROUP BY
                date,
                campaign_name
        ),

        sem_conversion_stats AS (

            SELECT
                etl_date AS date,
                source,
                campaignName AS campaign_name,
                COUNT(DISTINCT transactionId) AS transactions,
                SUM(totalRevenue) AS revenue

            FROM `your-project-id.your-dataset.your-google-analytics-4-table_202*`

            WHERE medium = 'cpc' AND (source = 'google' OR source = 'bing')

            GROUP BY
                date,
                source,
                campaign_name
        )

        SELECT
            campaign.date,
            campaign.source,
            campaign.campaign_name,
            campaign.clicks,
            campaign.impressions,
            campaign.cost,
            conversion.transactions,
            conversion.revenue

        FROM sem_campaign_stats AS campaign

        LEFT JOIN sem_conversion_stats AS conversion

        ON campaign.date = conversion.date
            AND campaign.source = conversion.source
            AND campaign.campaign_name = conversion.campaign_name

        ORDER BY
          date desc
Need Help?
If you're having any trouble setting up automated paid search marketing reports, then the experts at Calibrate would be happy to help. From walk-throughs and interactive demos to custom solutions, we'll help you to automate repetitive reporting tasks and bring new insights into the decision making process.