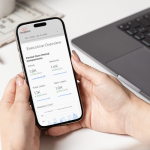
Google Sheets and Google BigQuery are two powerful tools that can be used to analyze and visualize large datasets. Connecting these two tools can provide an efficient way to work with data, allowing you to easily analyze and visualize large datasets stored in Google BigQuery using the familiar interface of Google Sheets.
Recently we shared an article outlining how you can create funnel visualizations in Looker Studio and Microsoft Power BI using the GA4 dataset in BigQuery (check out the article here). As an add-on, we are going to outline how you can connect Google Sheets to the same GA4 data in BigQuery and evaluate your funnel performance with a pivot table. Take a look at the steps below, and keep reading to see a detailed breakdown of each step.
- Build a funnel table using the native GA4 to BQ dataset (steps 1-3 in our previous post)
- Connect Google Sheets to BigQuery
- Create a pivot table in a new sheet
- Add device as your row dimension
- Add relevant cart events as your values (we used view_item_list, add_to_cart, begin_checkout, and purchase)
- Add a date filter
- Add conversion rates in the columns to the right of the pivot table
- Filter dates
How to Build a Conversion Funnel Report With the BigQuery GA4 Dataset and Visualize Your Data With Looker Studio or Power BI

Connect Google Sheets to BigQuery
- Open your Google Sheet and navigate to the "Data" option in the main navigation. Choose "Data Connectors" and then "Connect to BigQuery".

- Open your Google Sheet and navigate to the "Data" option in the main navigation. Choose "Data Connectors" and then "Connect to BigQuery".

Create a Pivot Table in a New Sheet
- Click on the pivot table option in the menu that populates in the body above the page.

- Add relevant cart events as your values (we used view_item_list, add_to_cart, begin_checkout, and purchase).

- Add conversion rates in the columns to the right of the pivot table.

Filter Dates
- You can optionally filter the dates of your data by adding the Date dimension as a filter.

- Choose the "Is Between" option. Add your desired date range and click "OK".

Transfer More Data
Google Analytics 4 is just one of many datasets that you'll likely want to access in an automated way. Transferring other sources of data to BigQuery is easy with Launchpad, our zero-code data transfer tool. Contact us at info@calibrate-analytics.com if you'd like to connect other data sources to BigQuery and your Google Sheet.


