Our experts explain the ways you can add these metrics to your reports and explore the pros and cons of each option.
Looker Studio charts are incredibly popular among marketers, analysts, and decision makers. That's because they're dynamic, insightful, and — usually — easy to set up. However, there are some situations that require just a few extra steps to configure.
One of the most common scenarios our customers have trouble with is creating charts that show GA4 transaction quantity with total revenue and transactions. While these are vital metrics for business owners to monitor and analyze, they can be tricky to work with because of how transactions are tracked in Google Analytics 4.
Thankfully, there are a few ways to get around this, so you can still show these metrics in your charts. Keep reading to learn more about what causes the issue, what your options are, and which solution is right for your organization.
Invalid configuration of metrics and dimensions
If you've tried to add the transaction and revenue total to your Looker Studio report along with quantity/items purchased, then you've likely been presented with the following screen indicating the dimension and metric combination is invalid.
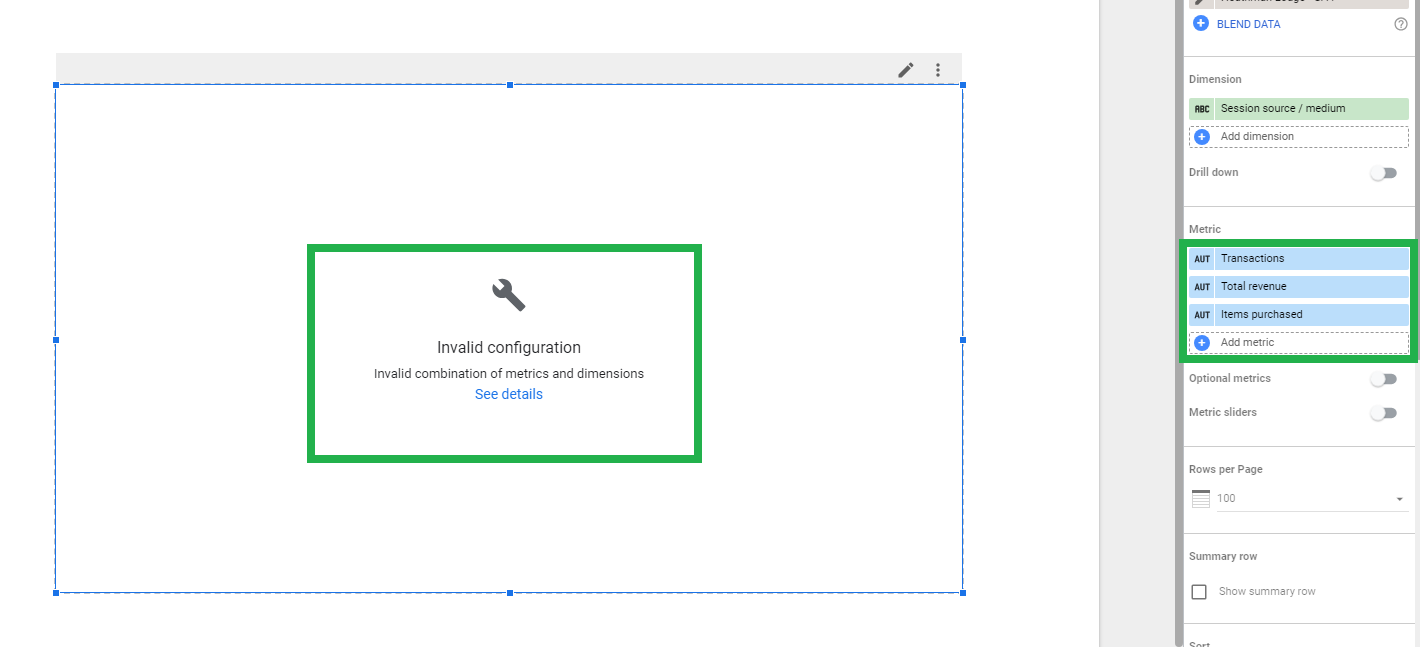
The reason items purchased cannot be paired directly with the transaction count is because many ecommerce sites now offer the ability to include multiple products and quantities in a single transaction. As a result, Google Analytics 4 has a separate object for the array of items that were included in the transaction.
At this time, the array in the items object cannot be unnested in Looker Studio, so you will need to consider the following options.
- Pass the quantity of your item(s) into a custom metric in GA4
- Use the GA4 BigQuery dataset to UNNEST the items array and JOIN on the transaction ID
- Use the GA4 API to transfer the required data into Google BigQuery, UNNEST the items array, and JOIN using the transaction ID
- Wait for Google to add total_quantity as a standard metric option in their GUI, API, and Looker Studio
Pass the quantity of your item(s) into a custom metric in GA4
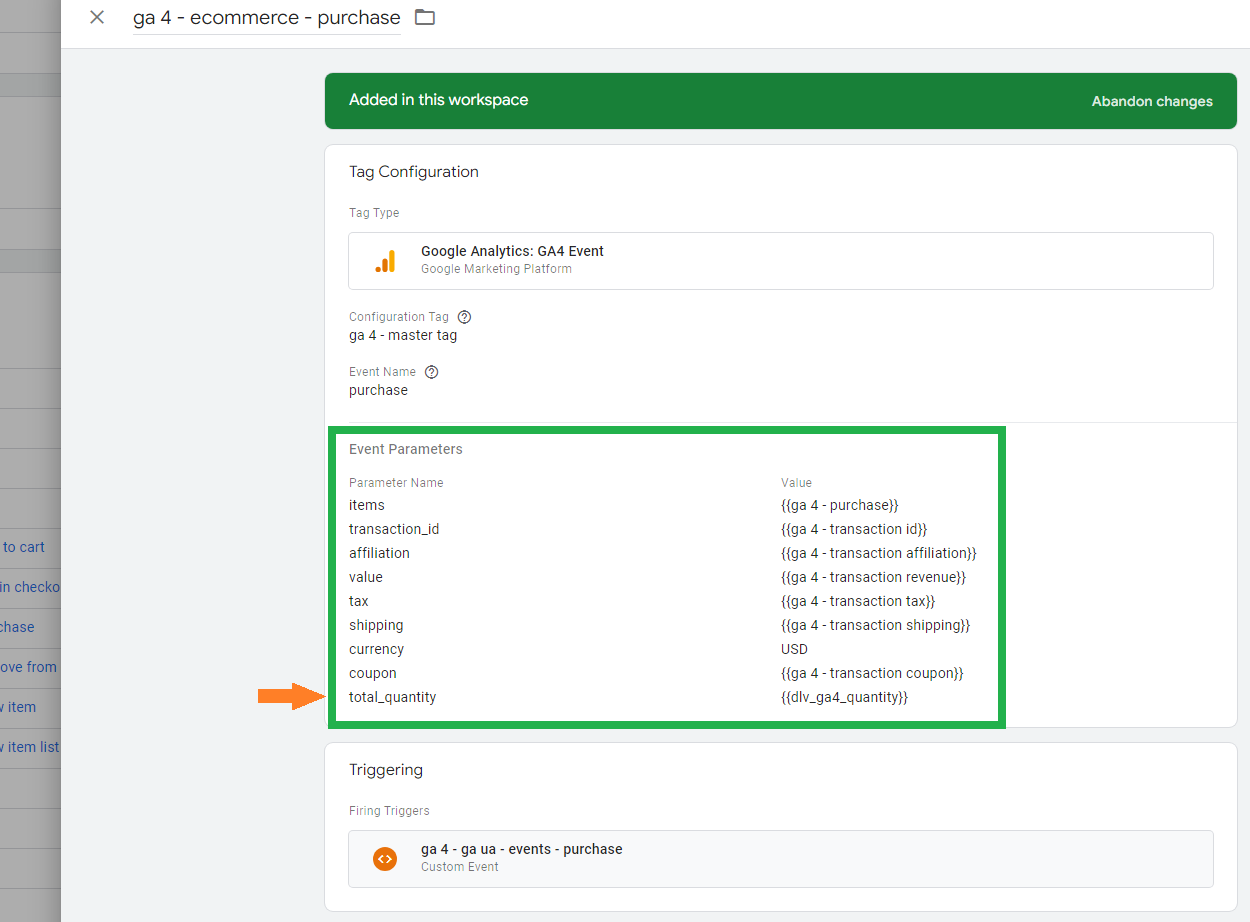
This solution will require an update to the Google Analytics 4 tagging on the ecommerce section of your site. The idea is to capture the item quantity in each product object (can be done using a custom JS variable) in the items array, add them, and pass to GA4 in your purchase event as a custom parameter. If you are not familiar with the JS necessary to build the custom variable, you can ask the provider of your ecommerce store to add the total quantity of items as a first order variable in their system data layer.
Once you have the variable working, you can include it in your purchase event tag as a parameter.
The new variable will begin to populate in GA4 after 24 hours, and then you'll be able to build a custom metric.
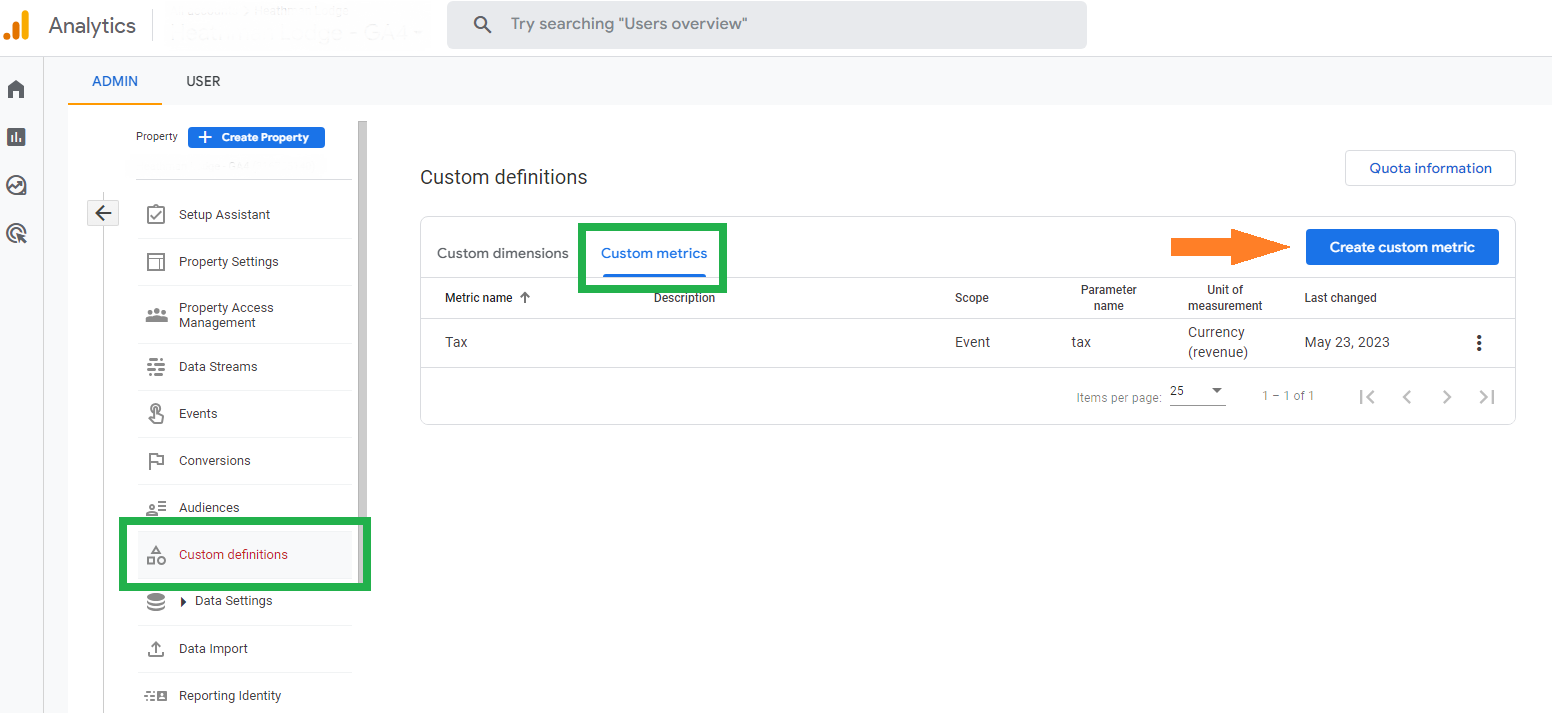
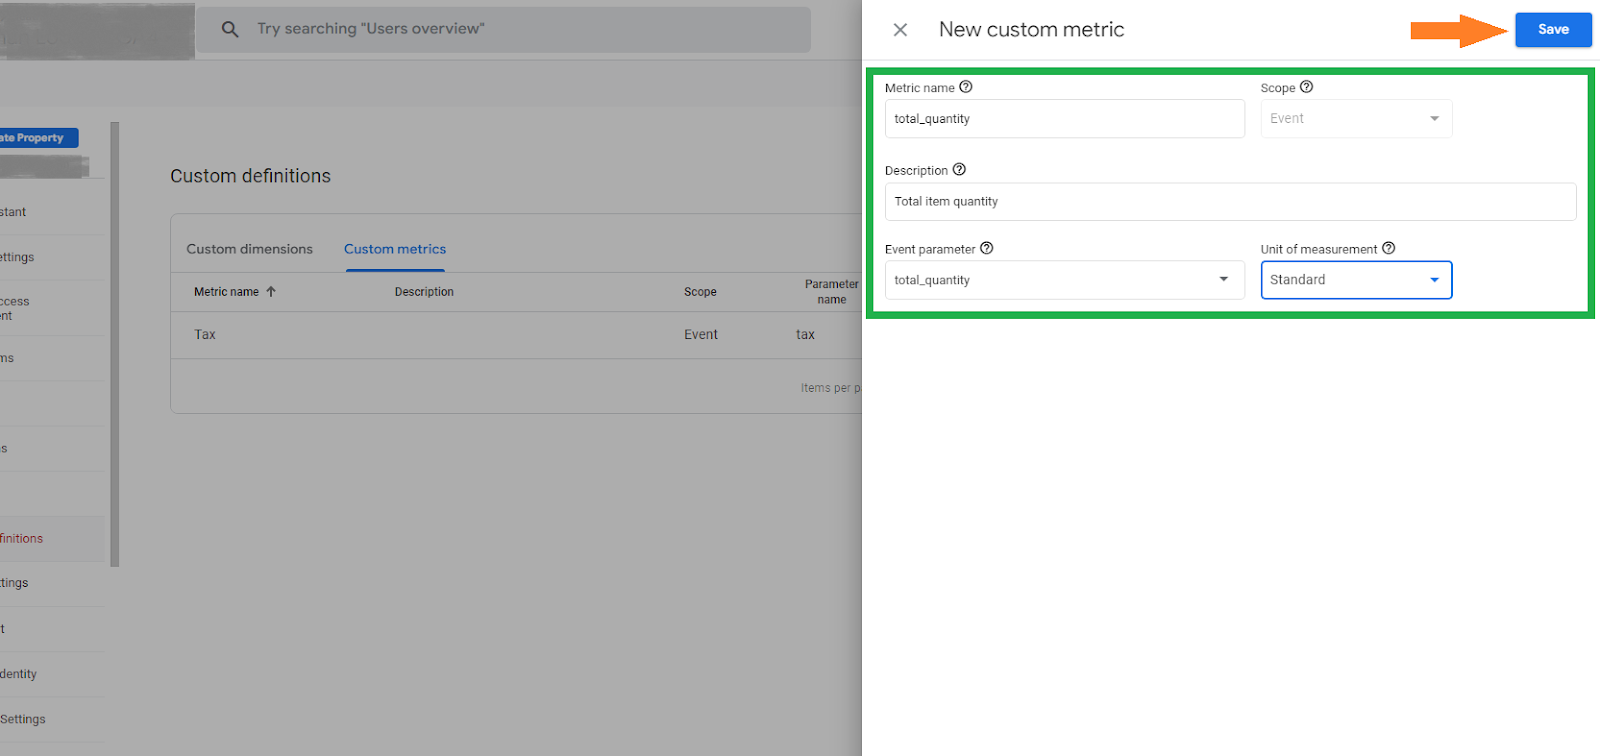
Build the custom metric by navigating to the "Custom definitions" section in your GA4 property and select the “Custom metrics” tab. Click on “Create custom metric”, provide a name and description, and select the corresponding parameter in the "Event parameter" dropdown.
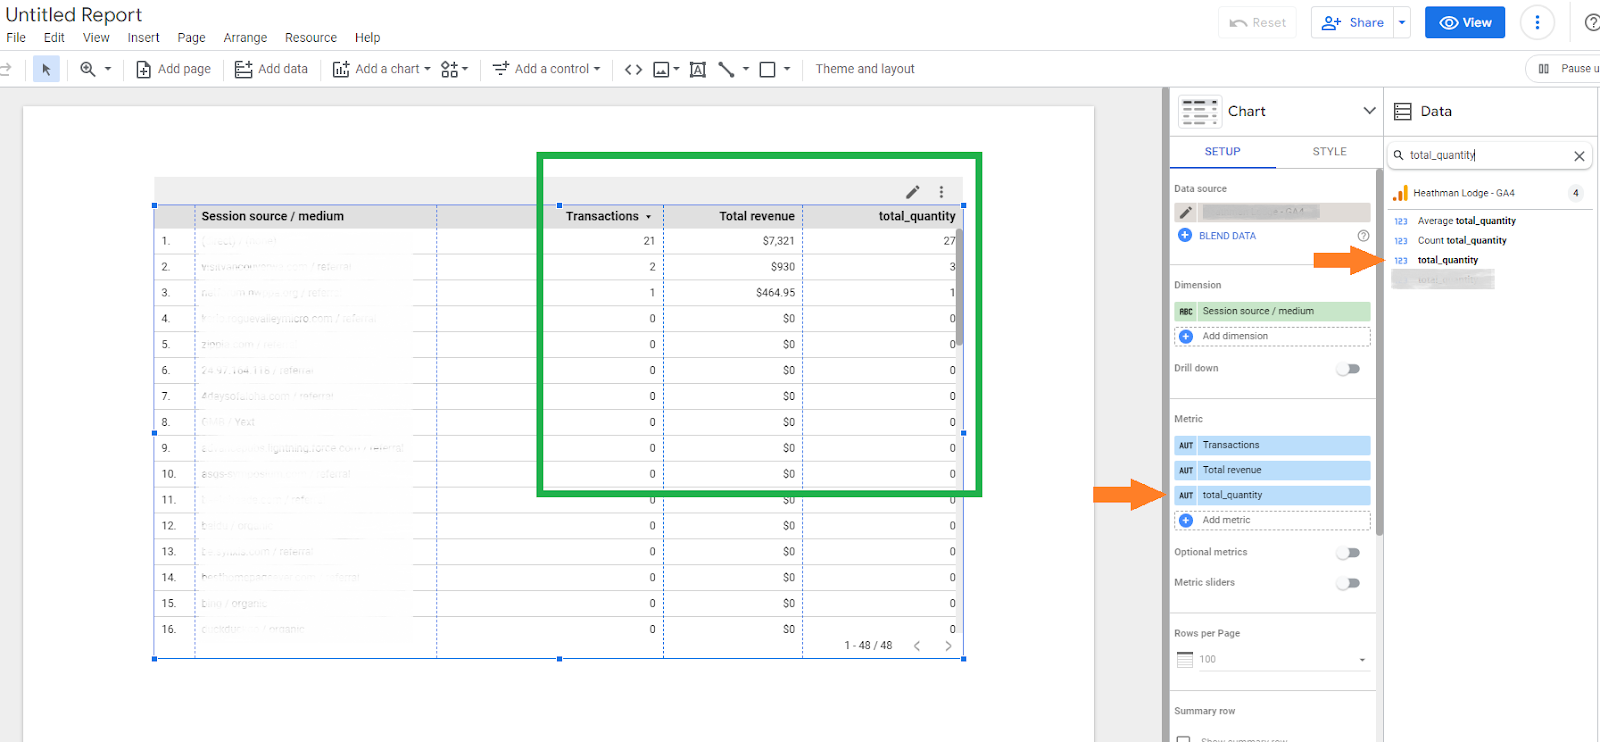
After you have created the custom quantity metric in GA4, you will need to update your GA4 source connector in Looker Studio. Do this by clicking on the pencil icon under data sources in the setup menu. Then click “Edit connection” and re-save the connection with the newly populated metric. You should see your custom metric populating in Google Looker Studio, and you can include it in your charts and calculations the same way you could with Google Universal Analytics (GA3).
Pros: This solution does not require knowledge of Google BigQuery or access to the GA4 API, and there are no additional costs outside of the cost to make the updates to the website.
Cons: You are limited to a total number of products and will not be able to discern between product types (unless you decide to create a custom quantity metric variable for each product type). This data will only be available from the time the tagging updates are published and begin to flow into GA4 (no historic data prior to the updates).
Use the GA4 BigQuery dataset to UNNEST the items array and JOIN on the transaction ID
If you have set up the connection with Google BigQuery (and we highly recommend you do) you can reference the total_item_quantity value in the ecommerce object. If you need to pull only the quantity for an individual item, you can write a query to UNNEST the items array, SUM the items purchased for the individual product(s), and JOIN the information using the transaction ID.
Below are two sample queries to demonstrate how this works.
Example using total_item_quantity
        SELECT
        PARSE_DATE("%Y%m%d", event_date) as date,
        traffic_source.source, /* User level / First source */
        traffic_source.medium, /* User level / First medium */
        traffic_source.name AS campaign_name, /* User level / First campaign name */
        SUM(ecommerce.total_item_quantity) AS quantity,
        SUM(ecommerce.purchase_revenue_in_usd) AS revenue_usd,
        COUNT(DISTINCT(ecommerce.transaction_id)) AS transactions

      FROM `{replace_with_your_gcp_id}.analytics_{replace_with_ga4_property_id}.events_202*`

      WHERE ecommerce.total_item_quantity > 0 /* Return only records with item quantity greater than zero */

      GROUP BY
        date,
        source,
        medium,
        campaign_name
Example UNNEST of the items array
        WITH items AS (
            SELECT
              PARSE_DATE("%Y%m%d", event_date) as date,
              ecommerce.transaction_id,
              SUM(quantity) AS quantity

            FROM `{replace_with_your_gcp_id}.analytics_{replace_with_ga4_property_id}.events_202*`

            CROSS JOIN UNNEST(items)

            WHERE item_id = '{your_target_product_id}' /* include your target product id/s here use an OR or REGEXP_CONTAINS statement for multiple products */

            GROUP BY
              date,
              transaction_id
          ),

          rev AS (
            SELECT
              PARSE_DATE("%Y%m%d", event_date) as date,
              traffic_source.source, /* User level / First source */
              traffic_source.medium, /* User level / First medium */
              traffic_source.name AS campaign_name, /* User level / First campaign name */
              ecommerce.transaction_id,
              SUM(ecommerce.purchase_revenue_in_usd) AS revenue,
              COUNT(DISTINCT(ecommerce.transaction_id)) AS transactions

            FROM `{replace_with_your_gcp_id}.analytics_{replace_with_ga4_property_id}.events_202*`

            WHERE NOT ecommerce.transaction_id IS NULL /* Restrict to records with a string in the transaction id field */

            GROUP BY
              date,
              source,
              medium,
              campaign_name,
              transaction_id
          )

          SELECT
            rev.date,
            rev.source,
            rev.medium,
            rev.campaign_name,
            SUM(rev.revenue) AS revenue,
            SUM(rev.transactions) AS transactions,
            SUM(items.quantity) AS quantity

          FROM rev

          LEFT JOIN items

          ON rev.date = items.date AND rev.transaction_id = items.transaction_id

          GROUP BY
            date,
            source,
            medium,
            campaign_name
After you have completed the query, you can build a new source in Looker Studio and populate your charts using the new table you've created.
Pros: This solution allows full control over which products are included in the items quantity, and you will be able to provide the data from the time your BigQuery connection was established.
Cons: Knowledge of Google BigQuery and SQL is required. Google BigQuery is cheap, but not free, so there are some additional costs.
Use the GA4 API to transfer the required data into Google BigQuery, UNNEST the items array, and JOIN using the transaction ID
This solution relies on querying the data from the GA4 API and transferring it to Google BigQuery. It's useful if you have not established the GA4 link to BigQuery and need to provide historical data in your Looker Studio report.
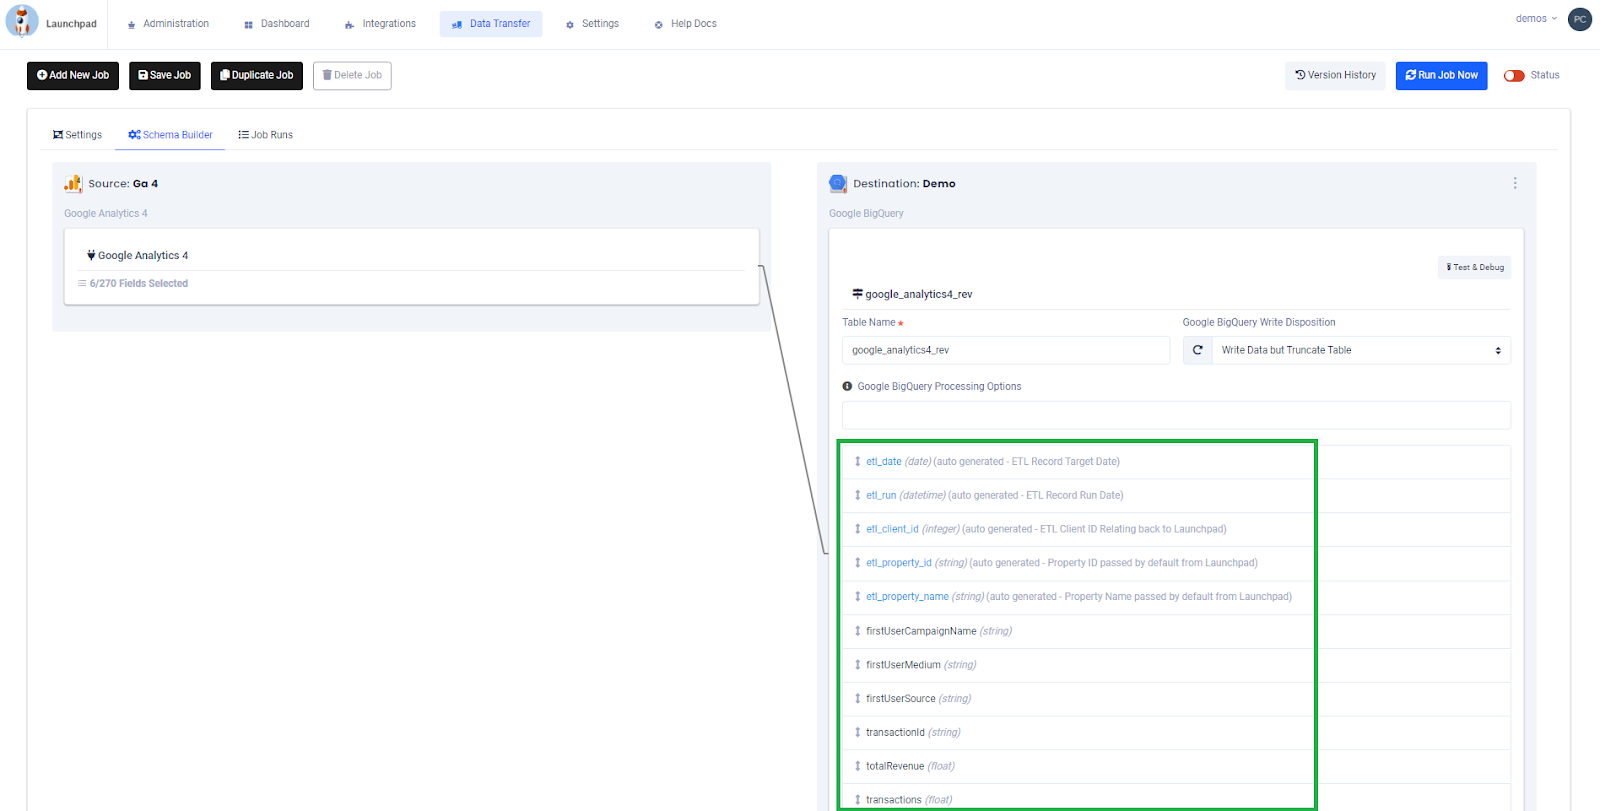
To accomplish this you will need access to an ETL (extract, transform, and load) application such as Launchpad. The ETL can connect directly to the GA4 API and will not require a single line of code.
You'll need to transfer the dimensions and metrics you want to JOIN with the items quantity in a separate ETL job from the job you'll use to transfer the information in the items array (the same invalid-combination rules apply to the API).
In the example below, we will use the same dimensions and metric combinations as the GA4 BigQuery dataset example.
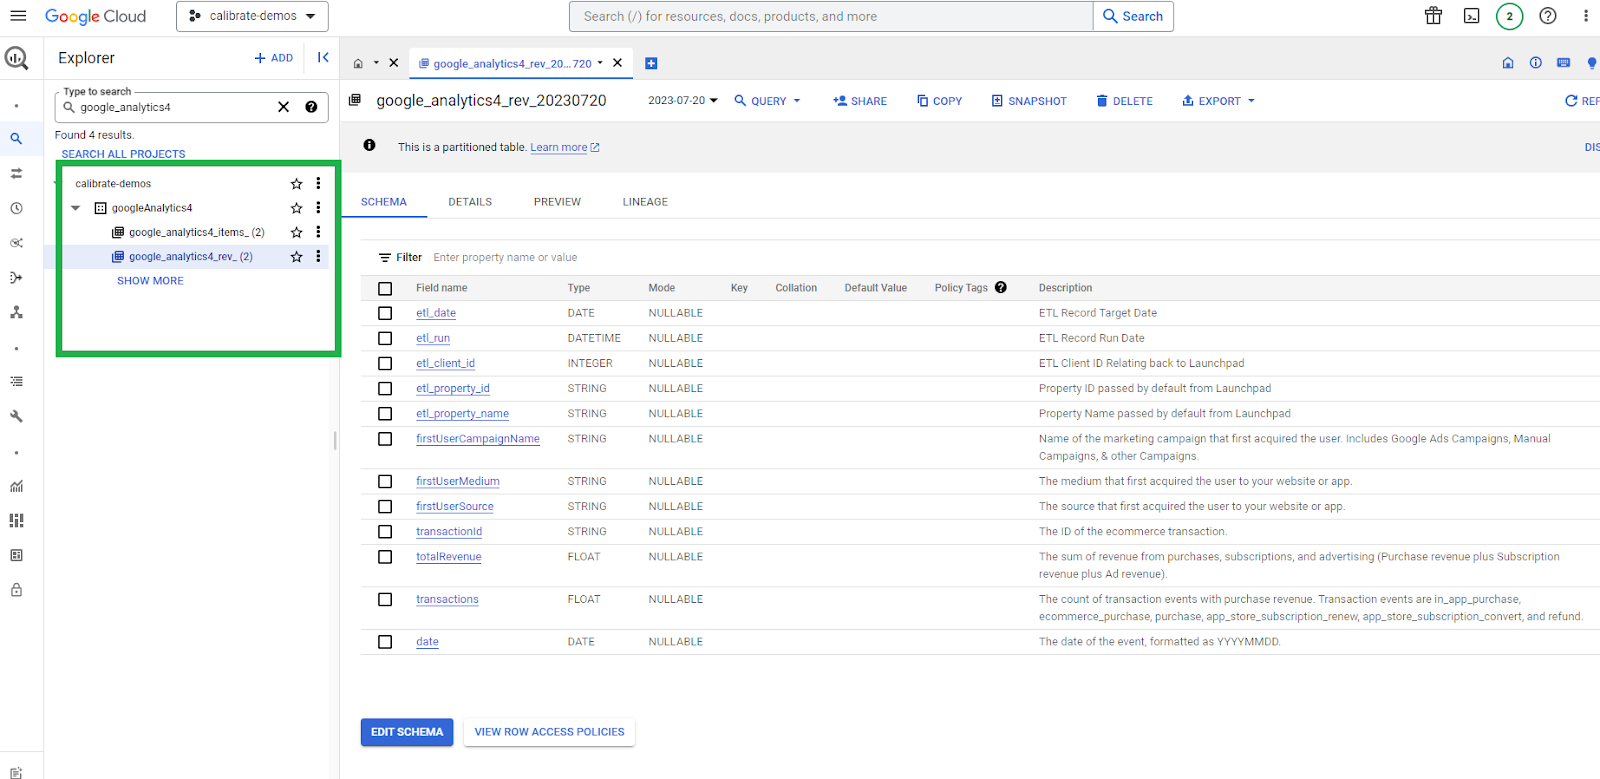
ETL rev Job:
Dimensions
- date (date)
- firstUserSource (string)
- firstUserMedium (string)
- firstUserCampaignName (string)
- transactionid (string)
Metrics
- transactions (integer)
- totalRevenue (float)
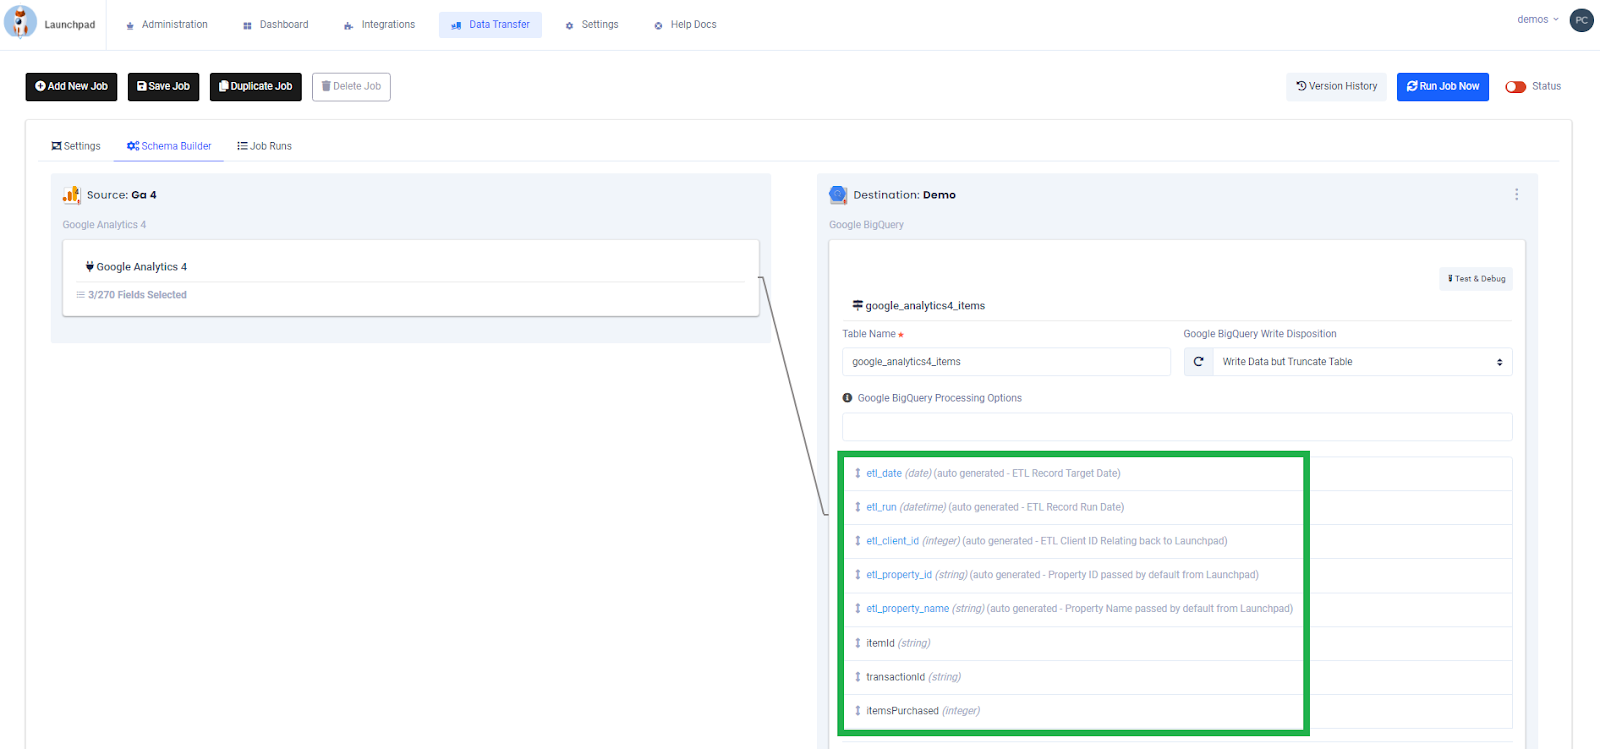
ETL Items Job:
Dimensions
- date (date)
- itemId (string)
- transactionId (string)
Metrics
- itemsPurchased (integer)
Once both datasets have been populated in Google BigQuery by your ETL, you can use a similar query to JOIN the data on transaction ID and build the end reporting table.
Example datasets
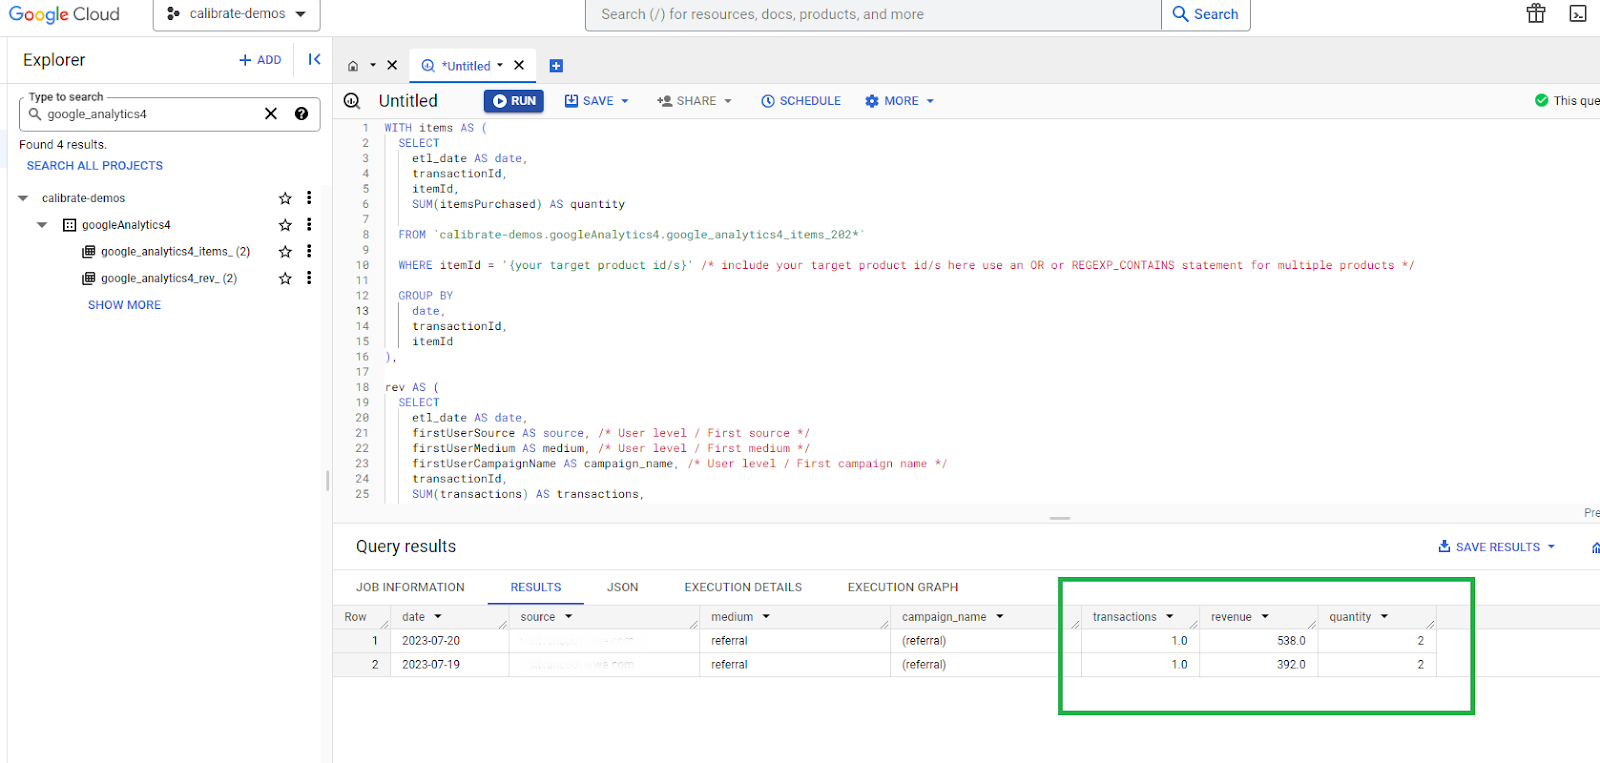
Example query
        WITH items AS (
            SELECT
              etl_date AS date,
              transactionId,
              itemId,
              SUM(itemsPurchased) AS quantity

            FROM {replace_with_your_gcp_id}.{replace_your_dataset_id}.google_analytics4_items_202*`

            WHERE itemId = '{your target product id/s}' /* include your target product id/s here use an OR or REGEXP_CONTAINS statement for multiple products */

            GROUP BY
              date,
              transactionId,
              itemId
          ),

          rev AS (
            SELECT
              etl_date AS date,
              firstUserSource AS source, /* User level / First source */
              firstUserMedium AS medium, /* User level / First medium */
              firstUserCampaignName AS campaign_name, /* User level / First campaign name */
              transactionId,
              SUM(transactions) AS transactions,
              SUM(totalRevenue) AS revenue

            FROM `{replace_with_your_gcp_id}.{replace_your_dataset_id}.google_analytics4_rev_202*`

            GROUP BY
              date,
              source,
              medium,
              campaign_name,
              transactionId
          )

          SELECT
            rev.date,
            rev.source,
            rev.medium,
            rev.campaign_name,
            SUM(rev.transactions) AS transactions,
            SUM(rev.revenue) AS revenue,
            SUM(items.quantity) AS quantity

          FROM rev

          LEFT JOIN items

          ON rev.date = items.date AND rev.transactionId = items.transactionId

          GROUP BY
            date,
            source,
            medium,
            campaign_name
Example output
Pros: This solution allows full control over which products are included in the quantity metric, and you'll be able to report on the full amount of historical data that has been captured by your GA4 account.
Cons: Knowledge of Google BigQuery and SQL is required. Google BigQuery is cheap, but not free, so there are some additional costs. ETL applications are also not free, so there are some additional costs associated with transferring the data..
Wait for Google to add total_quantity as a standard metric option in their API, GUI, and Looker Studio
At the time of this post, the total_quantity metric is not available in the GA4 GUI, Looker Studio, or the API, but it is available in the GA4 BigQuery export (as described in the BQ export solution), so we anticipate it will be added to the other systems in a future release. One option you may have to consider if you're not able to implement one of our other solutions is to simply communicate to your stakeholders that the purchase quantity cannot be displayed in the same chart alongside total transactions, total revenue, and parent level dimensions. You can, however, display all of the item information in a separate chart on the same dashboard to provide added context for your audience.
Pros: There are no additional costs or effort involved outside of keeping yourself up to date with the latest Looker Studio release notes.
Cons: You will not be able to add total_quanity to your charts until the metric is supported as a system standard. You will not have the ability to segment your quantity metric to a specific product or product category, such as shirt quantity vs. sunglasses quantity.
Choosing the best solution for your reporting
These four solutions provide you with a range of options to choose from based on your analytics tools, expertise, resources, and reporting needs. For some organizations, there may be only one or two viable options, while others will be able to consider or test them all out to determine the best process to integrate into their data flow. Of course, if you have any questions or need assistance implementing these processes, then the Calibrate team will be happy to help.
Get in touch and level up your analytics
The experts at Calibrate Analytics are always here to guide you through managing your data, optimizing your workflows, and building insightful reports. We can also walk you through our full-service ETL application, Launchpad, which lets you automate your reporting with ease. If you’d like to try it for yourself, then make sure to take advantage of Launchpad's free trial.