We love visualization apps at Calibrate Analytics. Not only do they look nice, but being able to leverage the right one — and even more than one — can truly unlock the power of your data. Thankfully, Google BigQuery and GA4 make it easier than ever to get the best out of the most powerful visualization apps.
This article walks you through the process of connecting multiple visualization apps to a GA4 dataset in Google BigQuery. We'll also show you how to build a funnel report with the standard GA4 ecommerce events.
Why Would You Use More Than One Visualization App?
One of the most common questions we get from our clients is which visualization app is the best for their reporting. The truth is, in many cases, we find that the best solution is to use multiple applications based on the unique needs, objectives, and stakeholder requirements of the business.
For example, we might suggest that a digital agency establish a Power BI reporting server for their customer-facing reporting. However, they may find that their media planners and campaign managers are power users in Looker Studio and prefer to use that for their own reports. With BigQuery and GA4, this can be set up and automated so that you don't need to compromise and limit yourself to only one option.
First Things First: Choosing a Data Warehouse
If you like the idea of being able to support multiple visualization apps, you'll need to select a data warehouse provider that can connect to the applications you want to use.
Major visualization tools like Looker Studio, Microsoft Power BI, and Tableau (there are many more) can connect to data stored in Google, Azure, AWS, and Snowflake data warehouses. For many of our clients, we recommend Google BigQuery due to its native integration with GA4 and affordable pricing.
Launchpad is Google Cloud Ready - BigQuery certified, a designation that Google reserves for partner solutions that meet key integration requirements with BigQuery. Read more.
How to Connect Multiple Visualization Apps to a GA4 Dataset in Google BigQuery
Connecting the visualization apps of your choice to a GA4 dataset in BigQuery can be done in just a few quick steps:
- Stream your GA4 data to BigQuery
- Unnest the conversion funnel events
- Sample query
- Configure a scheduled query and flattened table
- Connect to your table with Looker Studio
- Connect to your table with Microsoft Power BI
As part of the walk-through, we'll also show you how to build a funnel report with the standard GA4 ecommerce events.
1. Stream Your GA4 Data to BigQuery
If you're connecting GA4 data to BigQuery for the first time, you'll need to start by setting up BigQuery export. You can follow Google's setup guide here: [GA4] Set up BigQuery Export
2. Unnest the Standard E-commerce Funnel Events in GA4
Once you're set up to stream your GA4 data, you can copy the following query and paste it into your query editor in Google BigQuery. Update the project ID and dataset ID with the IDs from your project and dataset. Run the query and verify that you can see data populating in all of the columns.
    SELECT
    PARSE_DATE("%Y%m%d", event_date) as date,
    traffic_source.medium as medium,
    traffic_source.source as source,
    device.category as device,

    COUNT(DISTINCT(
      SELECT value.int_value
      FROM UNNEST(event_params)
      WHERE key = 'ga_session_id'
    )) AS sessions,


    COUNT(DISTINCT(
      SELECT value.int_value
      FROM UNNEST (event_params)
      WHERE event_name = 'view_item_list' AND key = 'ga_session_id'
    )) as view_item_list,


    COUNT(DISTINCT(
      SELECT value.int_value
      FROM UNNEST (event_params)
      WHERE event_name = 'add_to_cart' AND key = 'ga_session_id'

    )) as add_to_cart,


    COUNT(DISTINCT(
      SELECT value.int_value
      FROM UNNEST (event_params)

      WHERE event_name = 'begin_checkout' AND key = 'ga_session_id'
      )) as begin_checkout,

    COUNT(DISTINCT ecommerce.transaction_id) as purchase


  FROM `your-project-id.your-ga4-dataset.events_202*`


  GROUP BY
    date,
    medium,
    source,
    Device
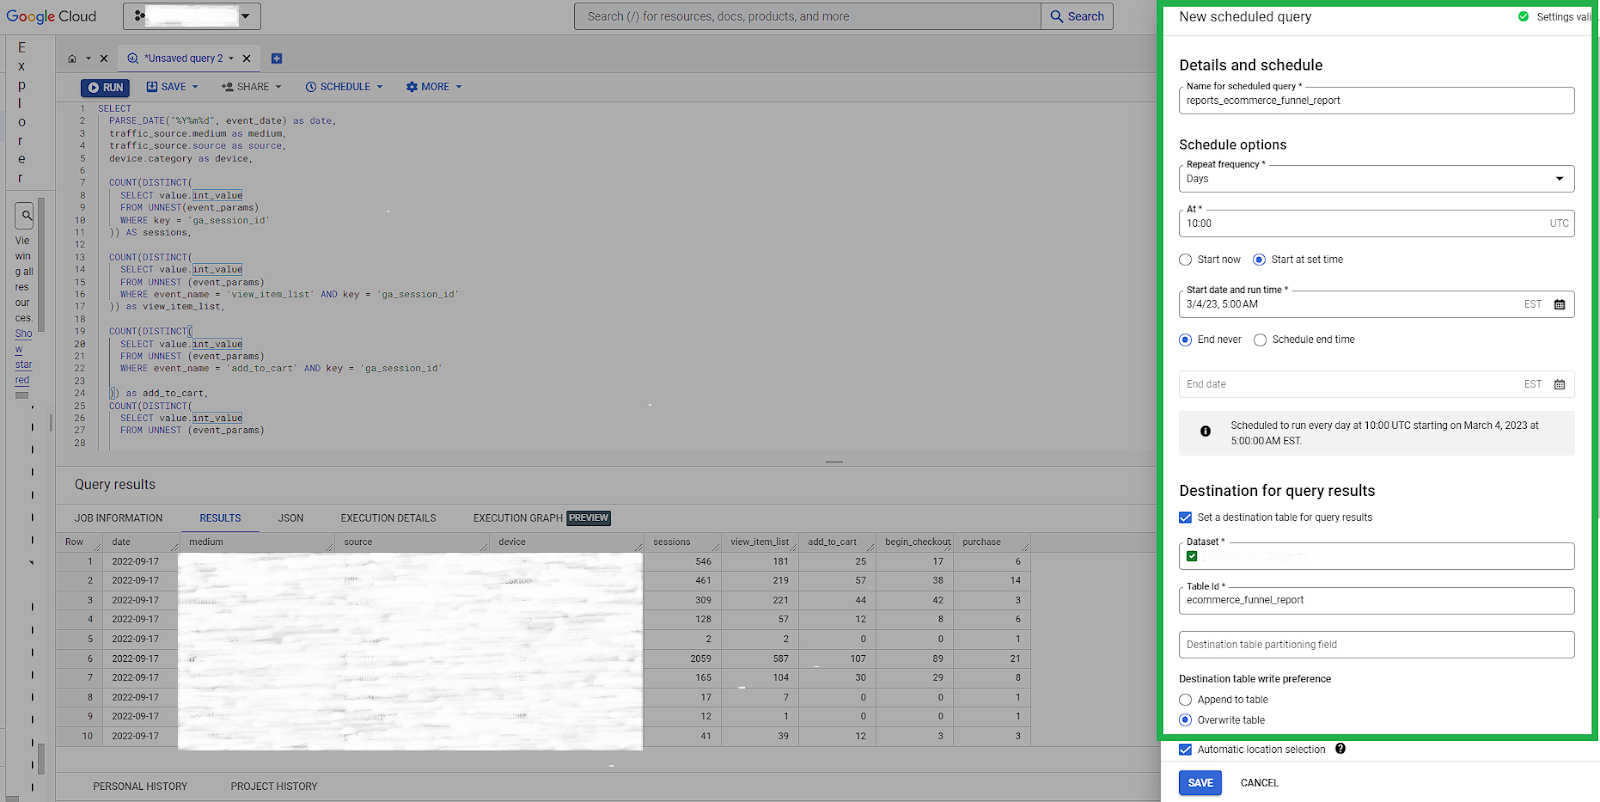
3. Configure a Scheduled Query and Flattened Table
After you've confirmed that the query is working, click on the scheduled option at the top of the query editor, and then click "create scheduled". Complete the scheduled query form and be sure to select overwrite as the write preference for your destination table.
Note: We suggest optimizing this query with date logic after you've finished the initial build, so you're only updating the table with new/yesterday's data. If you're dealing with very large GA4 datasets, you'll want to make sure to optimize the query so that the table only pulls new data and appends it to your destination table.
After your initial build of the table, you can add the following WHERE clause to your query and set the scheduled query to append as the write preference. This will append the data from two days prior to your destination table.
WHERE PARSE_DATE("%Y%m%d", event_date) = CURRENT_DATE() - 2
4. Connect to Your Table With Looker Studio
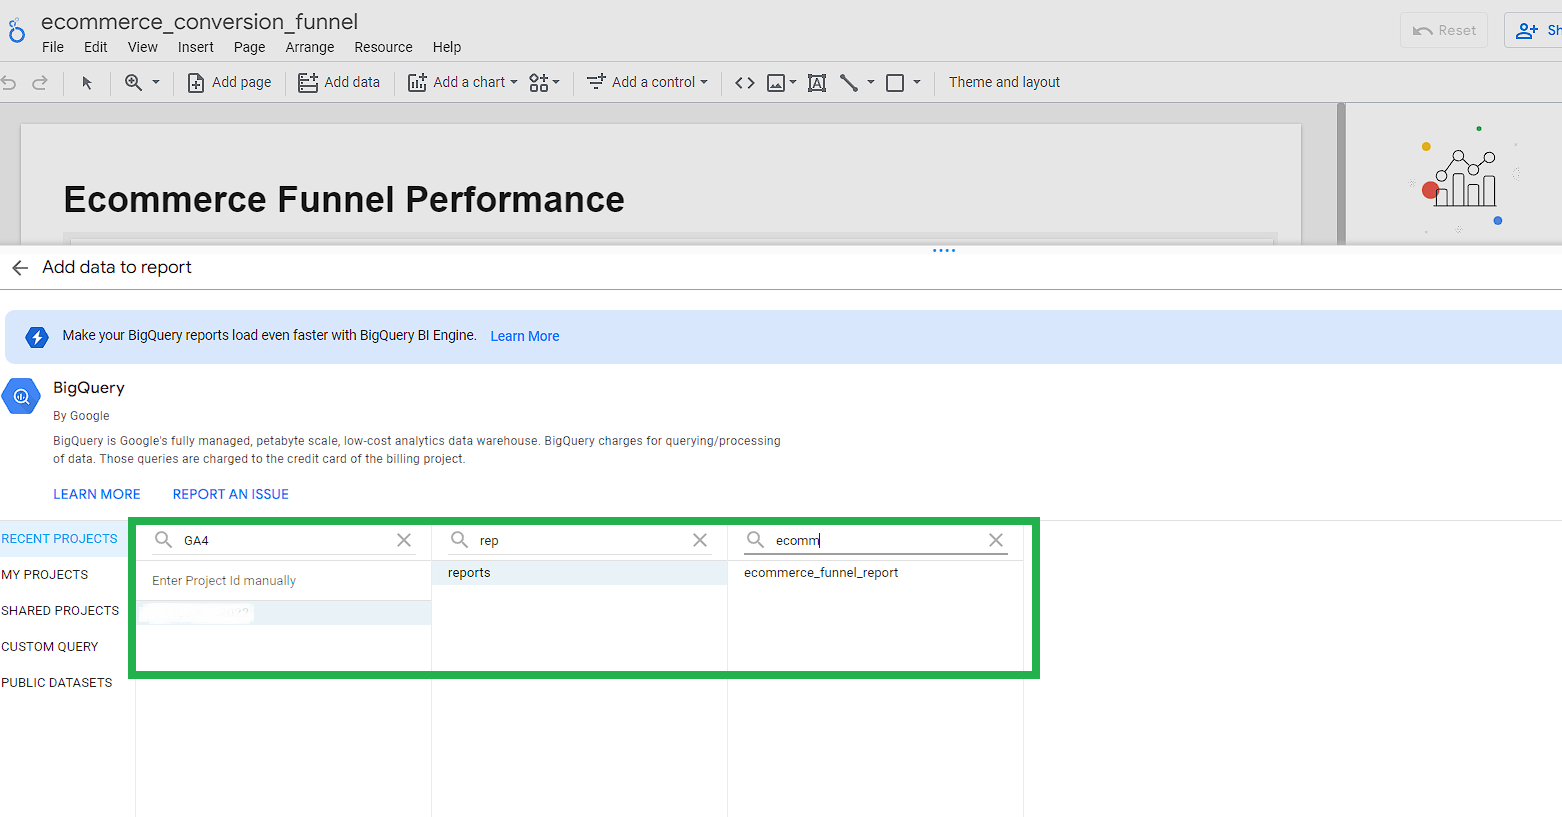
The next step is to connect your visualization app to your data. Choose “add data” in the Looker Studio menu, and navigate to the Google BigQuery source option. Select your project name, dataset, and table in the user interface.
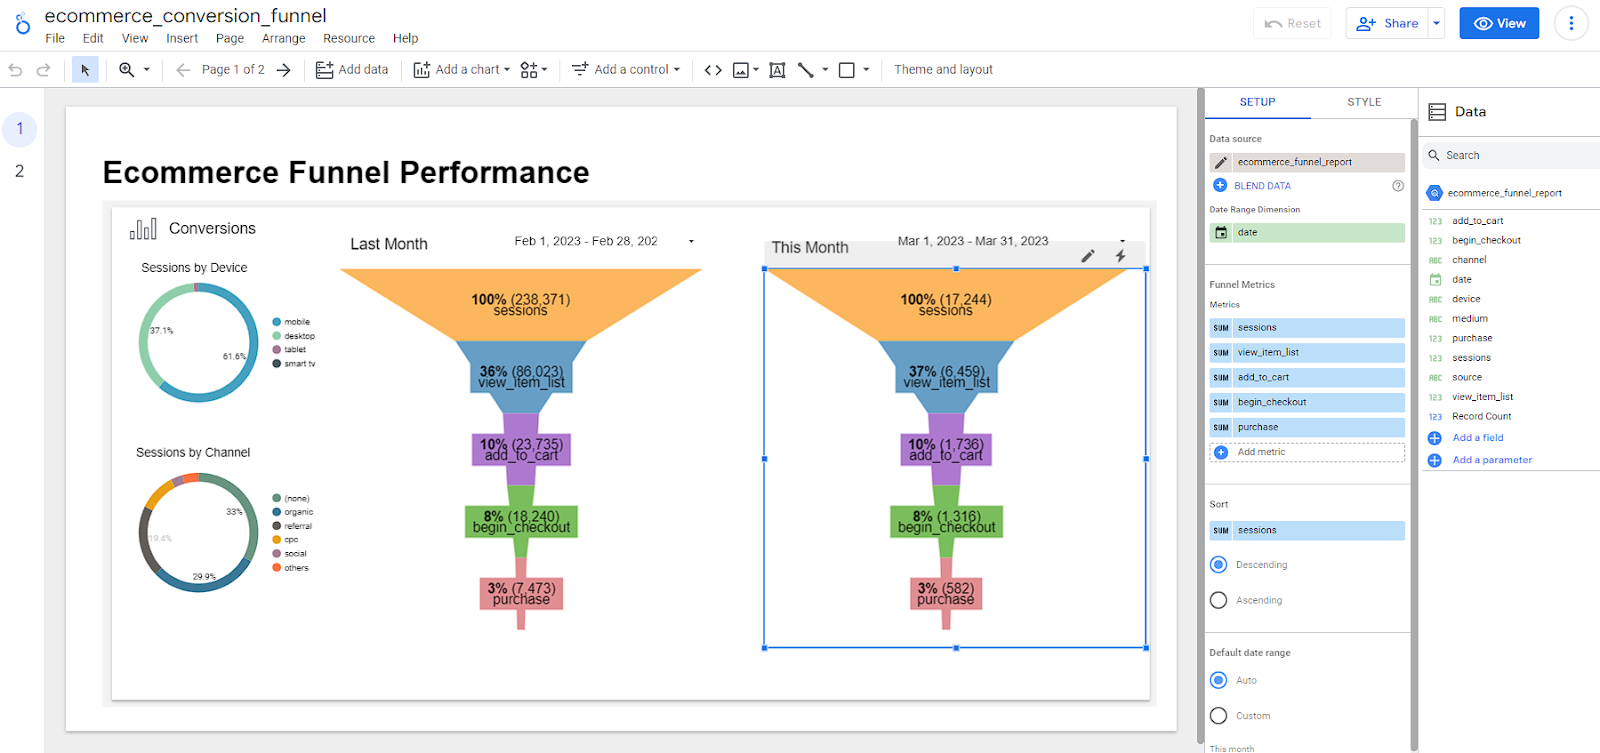
Connect the Data to a Funnel Chart
Choose a funnel chart and follow the chart instructions. In our example, these are the funnel steps included:
- Total sessions: Orange
- Distinct view_item_list events: Blue
- Distinct add_to_cart events: Purple
- Distinct begin_checkout events: Green
- Distinct purchase events: Pink
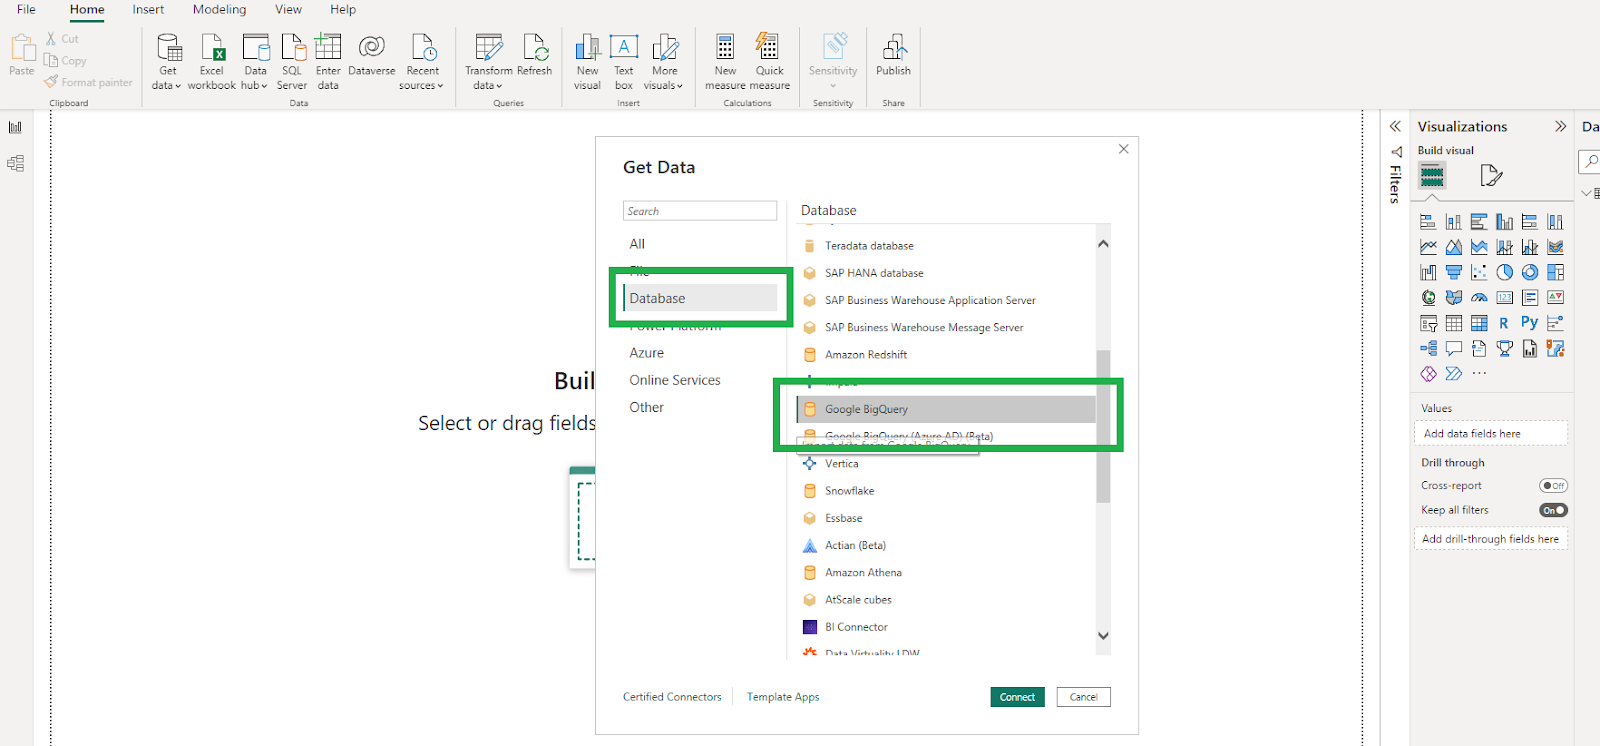
5. Connect Microsoft Power BI to Your Google BigQuery Project and Dataset
Choose "Get data" in the main menu and navigate to “Get data to get started”. Select "Database" and navigate to "Google BigQuery" in the selection box on the right. Authenticate with your Google Cloud Console account that has access to the dataset your funnel table is stored in.
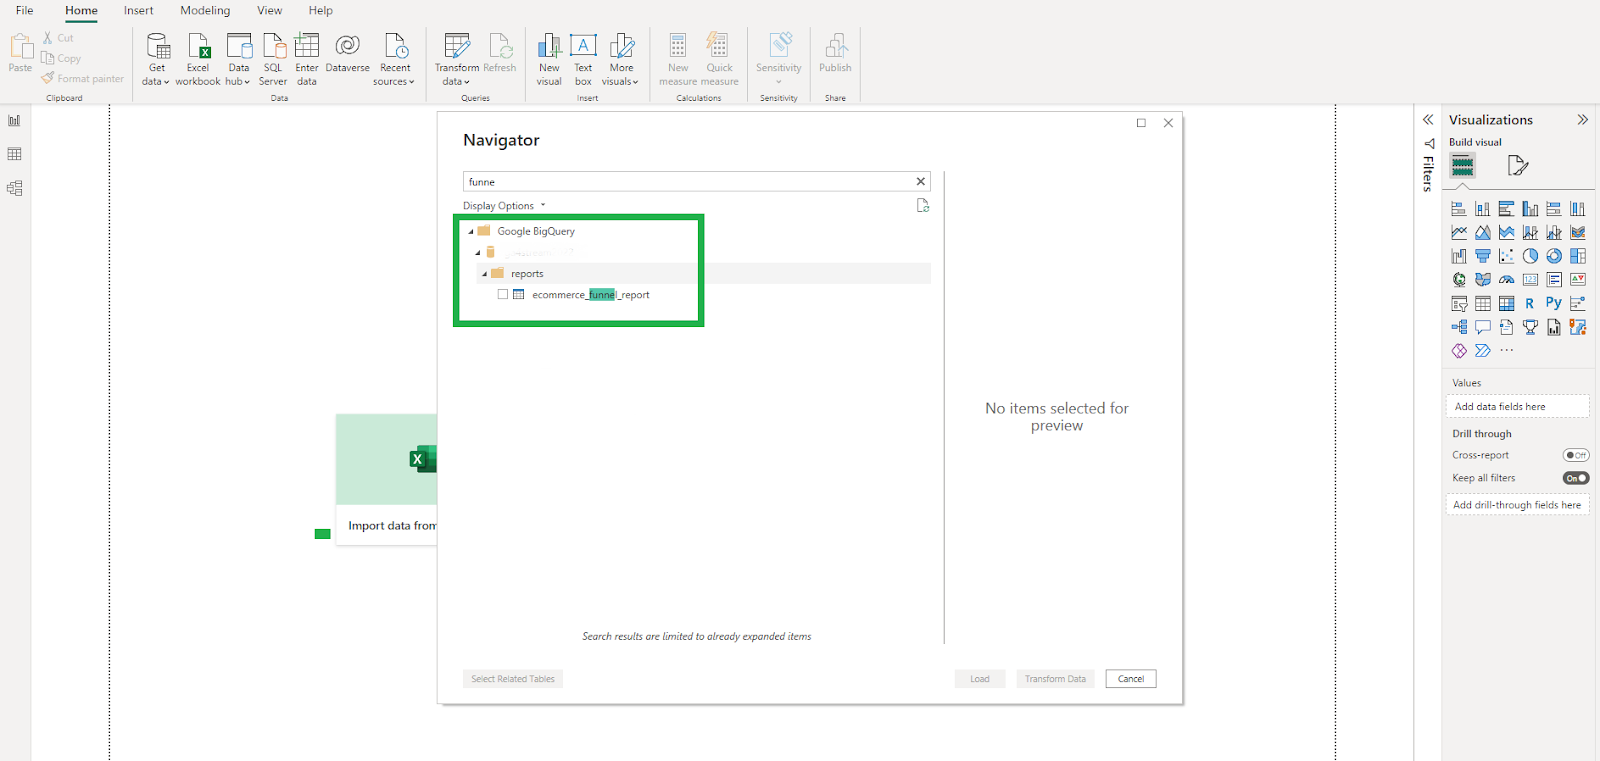
Connect Power BI to the Conversion Funnel Report Table
Search for "funnel" and select your table from the corresponding project and dataset folders.
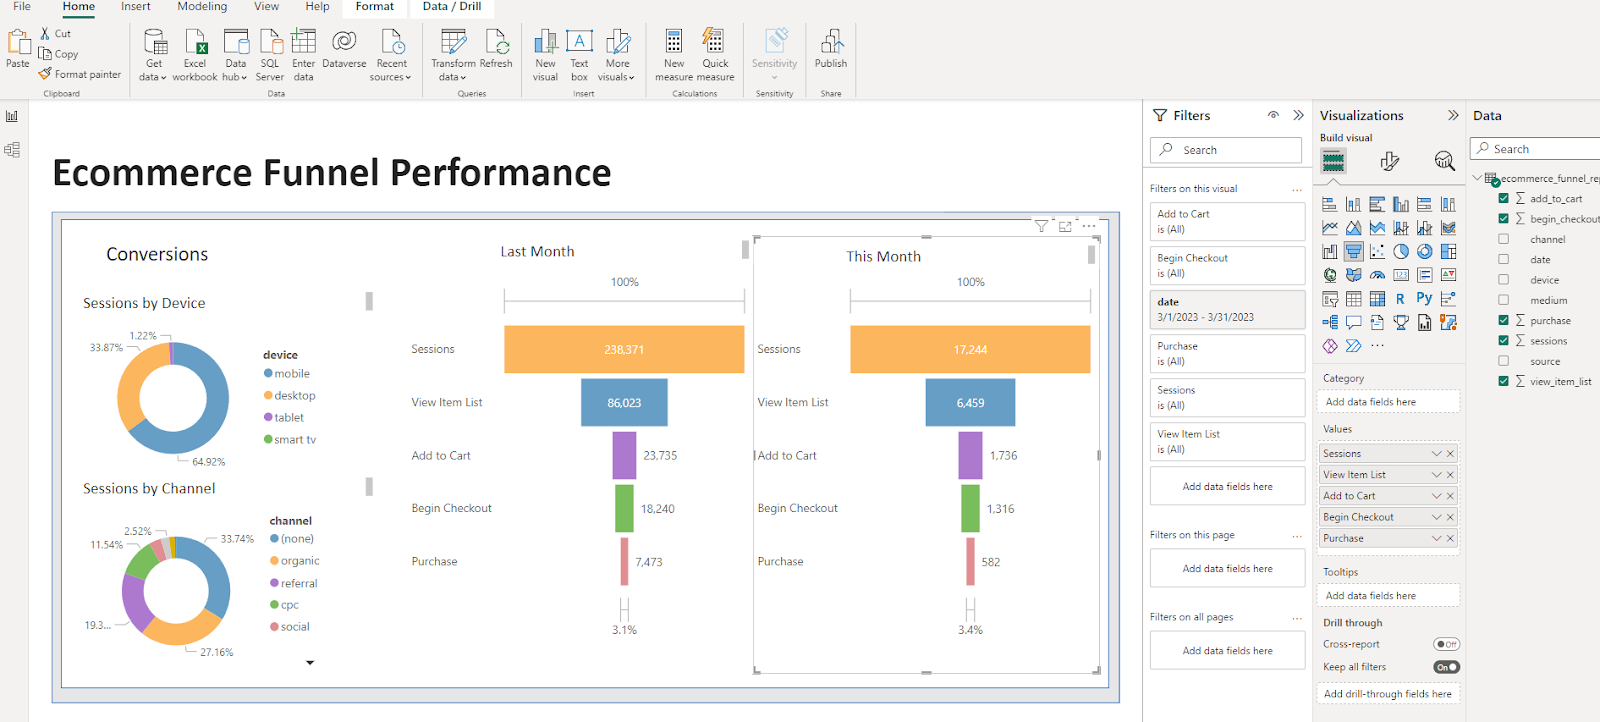
Connect Your Data to a Funnel Chart
Select the funnel chart in the system chart menu and add the corresponding metrics as values. Use date filtering and styling to achieve the same visualization we created in Looker Studio.
We're Here to Help
Looking for more data solutions? The professionals at Calibrate Analytics are experienced with the most popular data sources and storage options. Optimizing your analytics can save time, increase accuracy, and ensure that you're getting the best insights from your data. Discover our full-service platform, Launchpad, or let us tailor a custom solution that best suits your business.