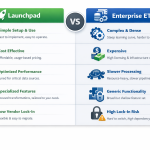
In our recent webinar, Calibrate Analytics co-founder Paul Cote demonstrates how marketers and analysts can harness the power of Looker Studio, Launchpad ETL, and BigQuery to integrate marketing data from both Google and non-Google sources into a unified reporting dashboard.
These dashboards are easy to automate, eliminating the need for manual data exports and making it easier to track and understand the performance of your campaigns.
How to Integrate Non-Google Data into Looker Studio
Using MailChimp as an example of a non-Google data source, the demo walks users through how to use Calibrate's Launchpad tool to extract data from the MailChimp API, store it in BigQuery, then visualize the metrics directly in Looker Studio.
Whether you're tracking open rates, CTR, or overall subscriber engagement, this process simplifies email marketing performance analysis, helping you quickly understand what's working in your campaigns.
At Calibrate Analytics, we recommend this approach as a best practice for integrating key data sources—whether it's Mailchimp, Facebook, Salesforce, Shopify, LinkedIn, or Google My Business—into BigQuery.
From there, Looker Studio offers a clean, user-friendly interface to display your data, meaning your reports are not just comprehensive, but also easily accessible and understandable.
Below are a few examples of the types of granularity you can achieve in your reporting.

Essential Webinar Insights
No Coding Experience? No Problem!
An important takeaway from the session is that setting up connections across platforms doesn't require an in-depth knowledge of BigQuery or SQL.
The demo highlights how straightforward it is to set up Launchpad, BigQuery, and Looker Studio, even if you have little to no coding expertise. It's a plug-and-play system designed for simplicity, allowing you to focus more on analyzing your data rather than worrying about technical hurdles.
The Best Way to Keep Your Data Fresh
Another key point we cover is the importance of keeping your data up-to-date. Calibrate recommends using dynamic date ranges that automatically refresh the last 30 days of campaign activity.
This ensures that your dashboard remains accurate without the need for manual updates. Forget pulling monthly manual reports! By scheduling daily data refreshes, you'll always have the latest metrics ready to go, allowing you to make data-driven decisions in real time.

Using Visual Cues for an Elevated Looker Studio Design
One final pro tip shared during the webinar is how you can enhance the clarity of your reporting by adding simple logos to dashboards in Looker Studio.
Logos that visually indicate the source of the data help you differentiate between metrics pulled from different platforms, such as Google Analytics, Google My Business, Facebook, etc.
This small but effective design element keeps your dashboard clean and focused, eliminating the need for extra text labels.
Ready to Get Started?
By automating data integrations and using tools like BigQuery, Launchpad, and Looker Studio, you can streamline your reporting process and free up valuable time. Calibrate Analytics specializes in helping businesses implement these systems efficiently. If you're interested in optimizing your data flows or exploring new analytics projects, we'd love to connect.


