Data can be a company's most valuable asset, and organizations are investing heavily in analytics, AI, and dashboards. But those investments only pay off when the underlying data pipelines are reliable. When pipelines break, data becomes delayed, corrupted, or lost, creating hidden costs that compound over time.
In this post, we'll walk through:
- A framework for understanding data ROI
- The visible and hidden costs of bad pipelines
- How a platform like Launchpad reduces those costs
- Steps to quantify ROI and build a business case
- Key metrics to track for long-term improvement
A Framework for Data ROI (and Why Downtime Matters)
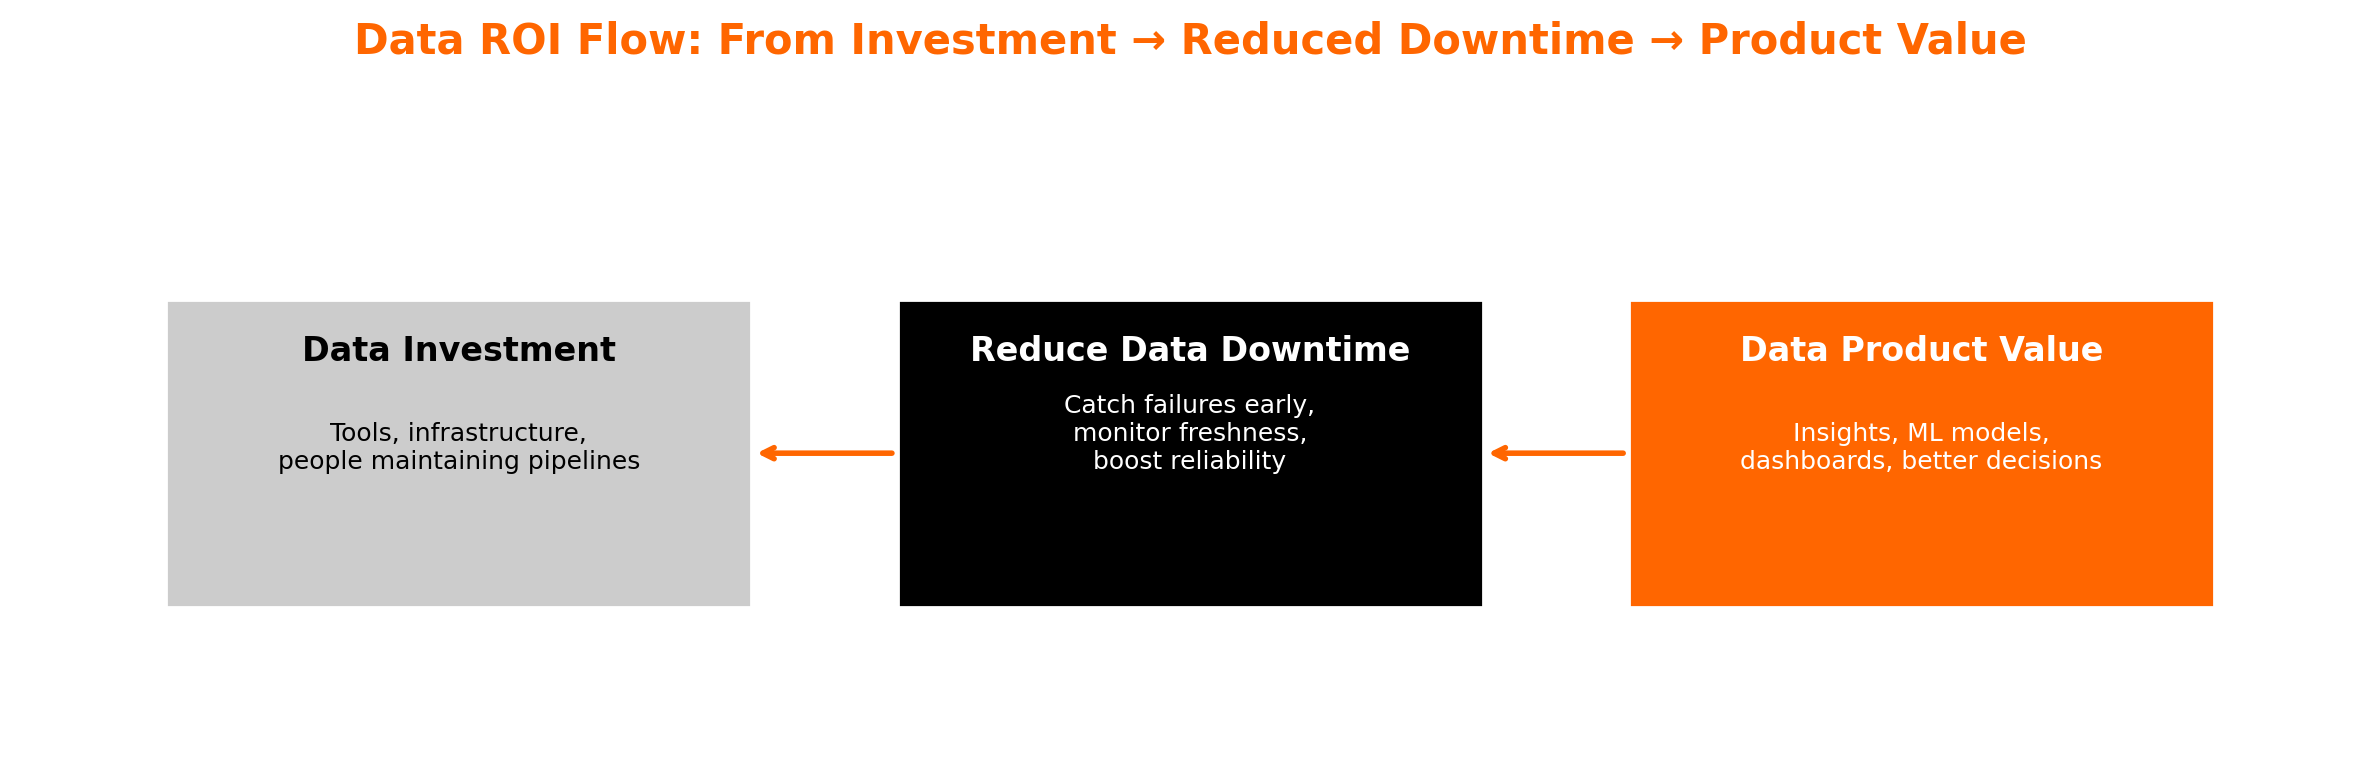
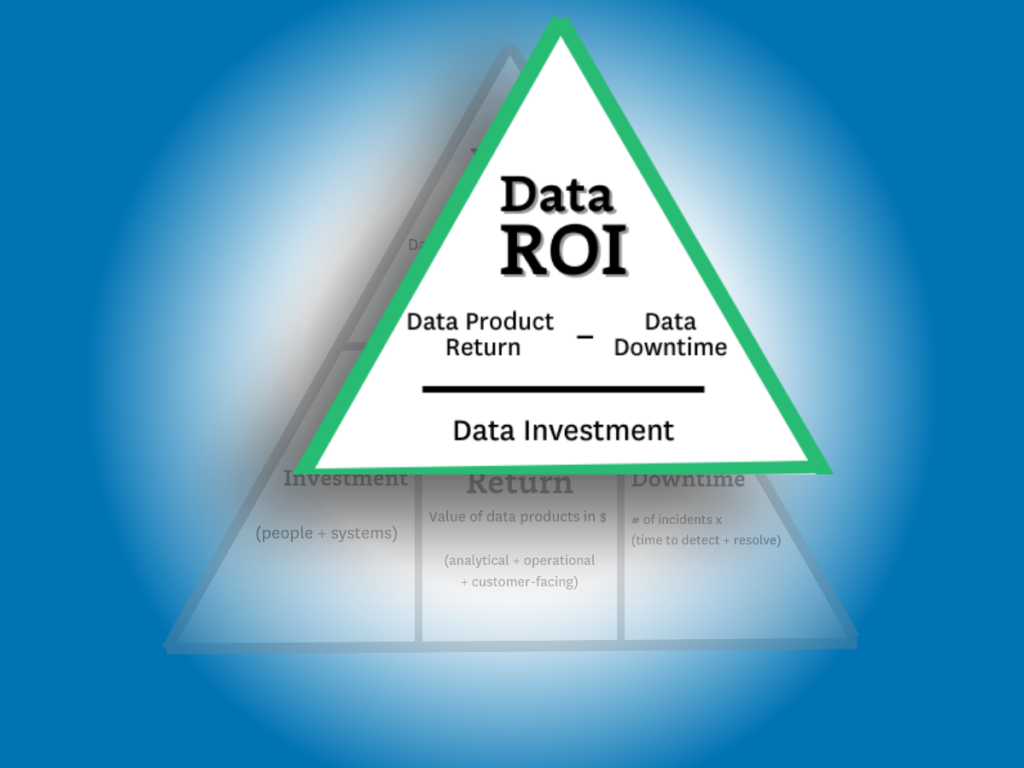
ROI = (Data Product Value - Data Downtime) / Data Investment
A useful starting point is the Data ROI Pyramid from Monte Carlo. This model highlights something many teams overlook: reducing downtime is just as important as increasing value or managing costs.
- Data Product Value includes the business or operational value generated through data: insights, machine learning models, dashboards, better decision-making, cost savings, and customer-facing applications.
- Data Downtime refers to periods when data is stale, broken, missing, or otherwise unusable. Downtime directly erodes value.
- Data Investment is the money spent on infrastructure, tooling, people, maintenance, and operations.
Small improvements in pipeline reliability can have a major impact on ROI, and industry research backs this up. Poor data quality and broken pipelines lead to lost revenue, wasted operational hours, bad decisions, and diminished trust across organizations.
The Costs of Bad Pipelines (Visible and Hidden)
Broken pipelines often lead to a range of data quality problems: incomplete or duplicate records, outdated information, missing fields, or inconsistent formats. Many of these costs are unnoticed until they start affecting performance or revenue.
1. Operational and Engineering Costs
- Incident resolution overhead: Engineers spend time debugging failures, tracing lineage, re-running jobs, and patching data.
- Delayed schedules: Downstream teams in marketing, analytics, or product are blocked waiting for data.
- Rework and correction: Manual fixes like data cleaning and deduplication add recurring overhead.
- Technical debt: Poor pipeline design compounds over time, making each failure more expensive to resolve.
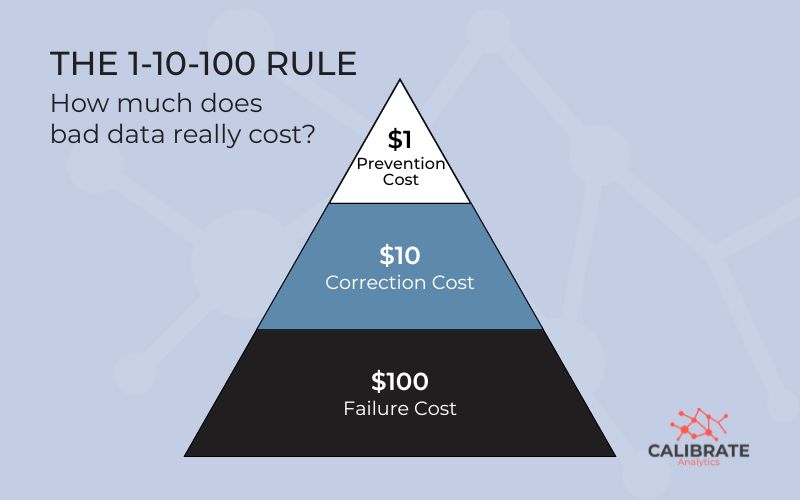
The 1-10-100 Rule was introduced by George Labovitz and Yu Sang Chang in Making Quality Work, and outlines how the cost of addressing data quality issues grows exponentially the later they're identified.
The 1-10-100 Rule:
- $1 to fix a data error at the point of entry, early in the pipeline.
- $10 to fix the same error once it reaches internal systems or processes.
- $100+ to fix it after it reaches the customer or starts informing business decisions.
2. Business and Revenue Costs
- Missed opportunities: Broken or delayed data can derail conversions, personalization efforts, and pricing decisions.
- Bad decisions: Executives or analysts acting on flawed metrics can misallocate budgets, over-invest in the wrong channels, or miss emerging risks.
- Customer experience fallout: Incorrect or inconsistent data in billing systems, profiles, or digital experiences erodes trust.
- Churn and retention damage: Customers who see inconsistent data are more likely to leave.
3. Indirect and Trust Costs
- Loss of data trust: If users don't trust pipelines, they inevitably bypass dashboards or build workarounds, fragmenting the analytics environment.
- Opportunity cost: Teams become hesitant to try new analysis or ML use cases because of reliability risk.
- Reputational and compliance liability: In regulated industries, bad data can lead to audit penalties or governance violations.
Bad data can cost businesses trillions of dollars annually in aggregate. These costs rarely appear on balance sheets but have real financial impact.
How Launchpad Can Help You Reduce Downtime
A modern Data Management Platform like Launchpad is built to minimize the likelihood and impact of pipeline failures, directly improving ROI.
| Capability | Benefits and Cost Mitigation |
|---|---|
| Connector library, managed integration | Reduces development effort and error in building custom connectors |
| Schema drift, version detection | Early detection of source changes avoids silent failures downstream |
| Retry logic, idempotency, error handling | Prevents pipeline breakage and reduces manual intervention |
| Alerting, notification rules | Faster reaction to failures, less downtime |
| Dependency management, orchestration | Ensures coordinated runs, reduces cascading failures |
| Backfill, safe reload support | Eases remediation, reduces risk of data gaps |
| Monitoring, lineage, observability tools | Helps root-cause analysis, builds data trust |
By adopting a reliable platform, data teams spend less time fighting fires and more time on strategic work that drives value. This leads to leveraged ROI, where reliability improvements multiply upstream analytics and business outcomes.
How to Quantify ROI and Build a Business Case
To make a compelling case for investing in pipeline reliability, tie it back to the numbers. Here's a step-by-step approach:
1. Establish a Baseline for Current Costs
- Estimate engineering hours spent each month on pipeline issues.
- Quantify manual rework time (e.g., data cleaning, deduplication).
- Estimate the financial impact of delayed or broken reports (missed deals, campaign underperformance).
- Track frequency and duration of pipeline downtime.

2. Estimate the Improvement
- Project the % reduction in incidents/downtime after adopting a data management platform like Launchpad.
- Create a use case for no cost with a 2-week free trial.
- Estimate reductions in manual cleanup work.
- Identify potential revenue and cost savings from more timely insights with less manual work.
3. Compute ROI
ROI = (Value from Reduced Downtime + Value from Improved Insights - Cost of Implementation) ÷ Cost of Implementation
Run conservative, base, and aggressive scenarios to show a range of outcomes. For example: 20%, 50%, and 80% fewer failures.
4. Include Intangible Benefits
Highlight qualitative benefits like improved data trust and dashboard adoption, and greater innovation to strengthen executive support for investment.
Reference case studies and best practices to emphasize how data management programs can yield over 300% ROI over several years.
5. Key Metrics to Drive Long-Term Improvement
Once reliability initiatives are in place, track progress with clear metrics:
- Pipeline uptime and availability (%)
- Mean time to detect (MTTD)
- Mean time to repair (MTTR)
- Number of failed jobs per period
- Rework or manual correction hours
- Backfill frequency and cost
- Data freshness and SLA compliance
- User adoption and trust metrics
- Cost per incident (labor, compute, lost opportunity)
These metrics act as levers. For example, if MTTR is high, optimize alerting and retries. If rework hours are excessive, standardize validation rules. If downtime is frequent, invest in redundancy or circuit breakers.
As reliability improves, the “Data Downtime” term in your ROI formula shrinks, making your analytics investments more resilient and valuable over time.
Reliability Unlocks Compounding Returns
Brittle pipelines act like hidden taxes that drain resources, frustrate teams, and undermine strategic initiatives. By investing in pipeline reliability, companies unlock compounding returns:
- Engineers focus on innovation instead of firefighting
- Analysts trust their dashboards
- Executives make faster, more accurate decisions
- Marketing and operations benefit from timely, reliable insights
At Calibrate Analytics, Launchpad is designed to deliver reliability at scale. If you'd like help estimating your ROI or running a pilot pipeline, talk to us to explore how Launchpad can transform your data pipelines into a competitive asset.