BigQuery has a reputation for being a powerful, enterprise-scale data warehouse, and most conversations around it can quickly turn technical.
For quick insights, most analysts just need reliable dashboards, accurate metrics, and a way to work with warehouse data without needing a data engineering background.
Luckily, you don't need to be a SQL wizard to look like a pro.
The combination of Google BigQuery (where the data lives) and Looker Studio (where the data gets visualized) is surprisingly friendly to non-coders, if you know where to look.
"Fake it until you make it" doesn't mean guessing at numbers or avoiding good data practices. It means using the tools and layers that already exist to abstract the complexity. When the stack is set up correctly, you can build useful, professional dashboards on top of BigQuery without writing any SQL.
Here are five ways you can bypass SQL and unlock the power of BigQuery using Looker Studio, without ever writing a SELECT * FROM statement.
1. The Straight-to-Table Connection
One of the biggest misconceptions about BigQuery is that you always need a custom query to get data out of it. You don't.
If your data engineering team has already created a clean, final table in BigQuery (e.g., final_sales_Q3), you can connect to it directly from Looker Studio.
Looker Studio will pull in every column as a dimension or metric, and you can immediately start building charts.
How to fake it:
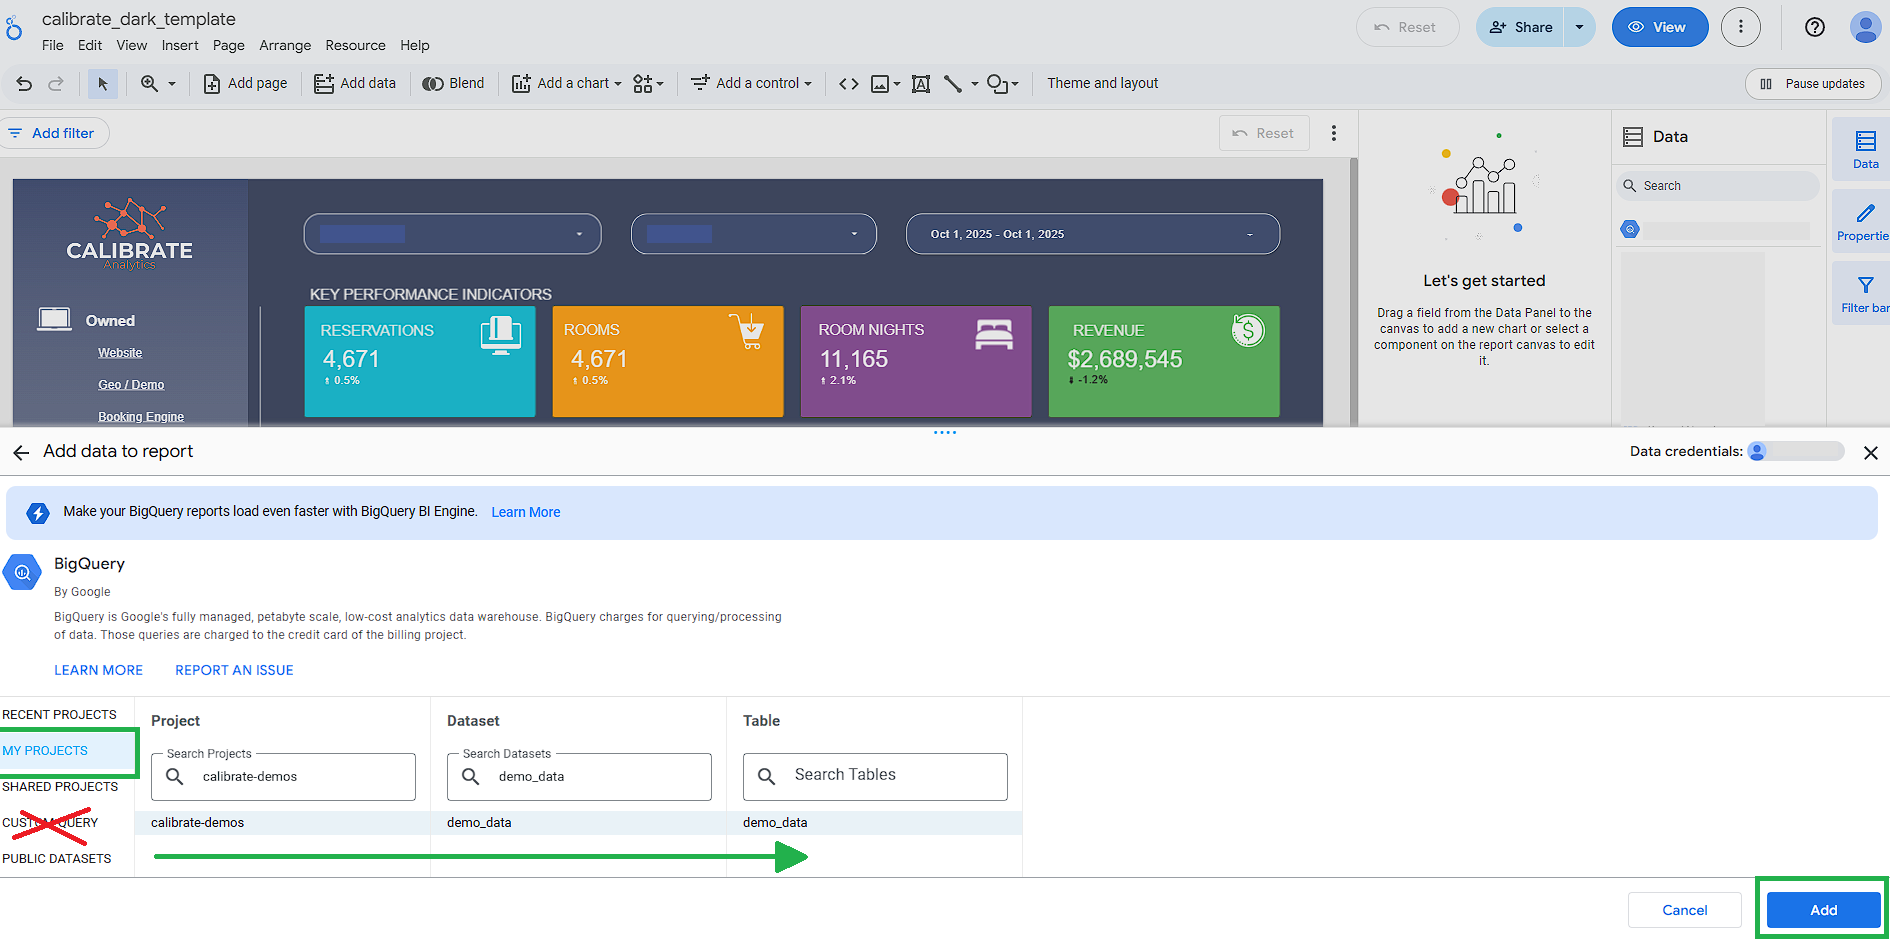
When you connect Looker Studio to BigQuery, you're presented with two primary options: "Custom Query" (the SQL route) and "My Projects" (the easy route).
Navigate through "My Projects" to your dataset, find the pre-built table you need, and click connect. Looker Studio will pull in every column as a dimension or metric, and you can start dragging and dropping fields into charts.
Use this approach to build full dashboards without writing any SQL.
2. Outsourcing Transformations to ETL Tools
Raw data often needs filtering, formatting, and aggregation before i's ready for reporting.
Usually those transformations are handled in BigQuery with SQL scripts, creating a bottleneck when every small change requires engineering time.
Using an ETL, you can define filters, calculated fields, naming rules, and aggregations through a no-code interface. The system handles the underlying SQL and writes clean, structured tables back into BigQuery.
How to fake it:
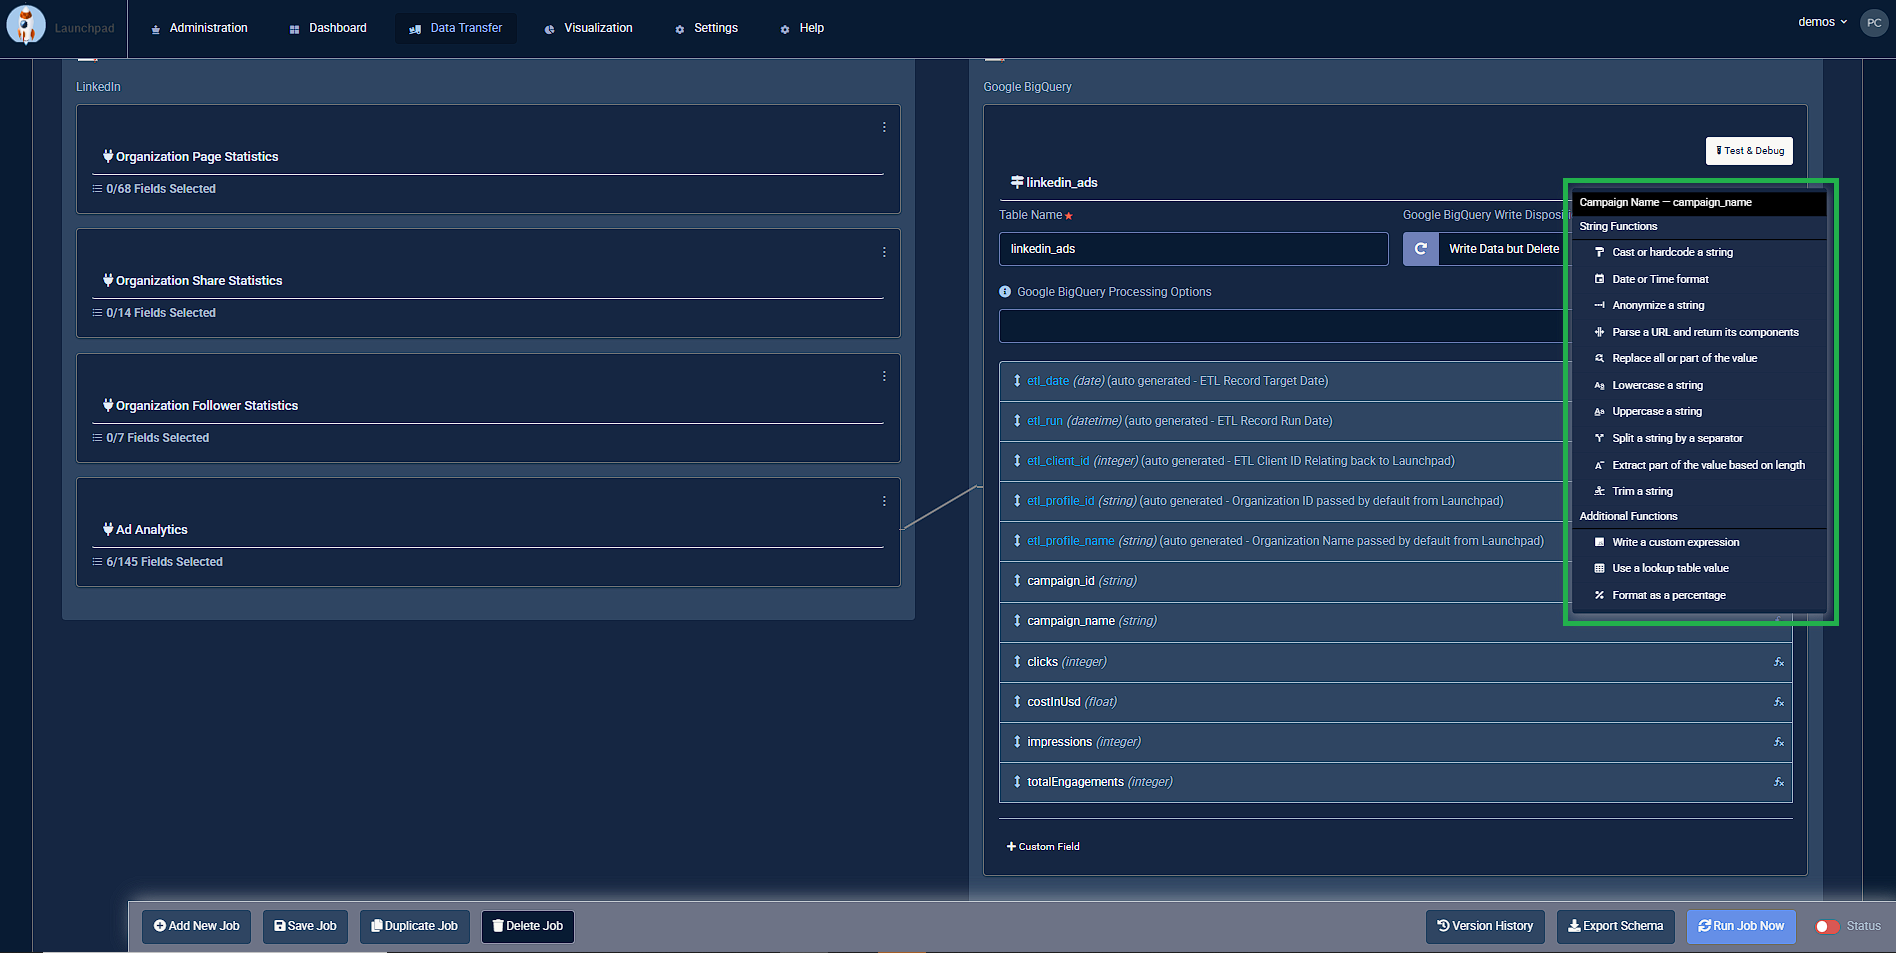
Use a platform that doesn't require any SQL knowledge, like Launchpad. These platforms handle data transformations for you before the data lands in BigQuery.
Using Launchpad's visual interface, you can:
- Filter out test accounts
- Standardize currency formats
- Group sales by region
- Define additional rules needed for your reporting
Launchpad handles the heavy lifting in the background and delivers a dashboard-ready table into BigQuery.
Reference: https://calibrate-analytics.com/launchpad/
3. Performing "Lite Math" with Looker Studio Calculated Fields
Sometimes your dataset is almost complete but missing one crucial metric.
Perhaps you have Total Revenue and Total Cost, but your boss wants to see Return On Ad Spend (ROAS).
A SQL pro would write something like SUM(revenue) / IFNULL(SUM(spend), 0) AS ROAS directly in the database query. You don't have to do that.
How to fake it:
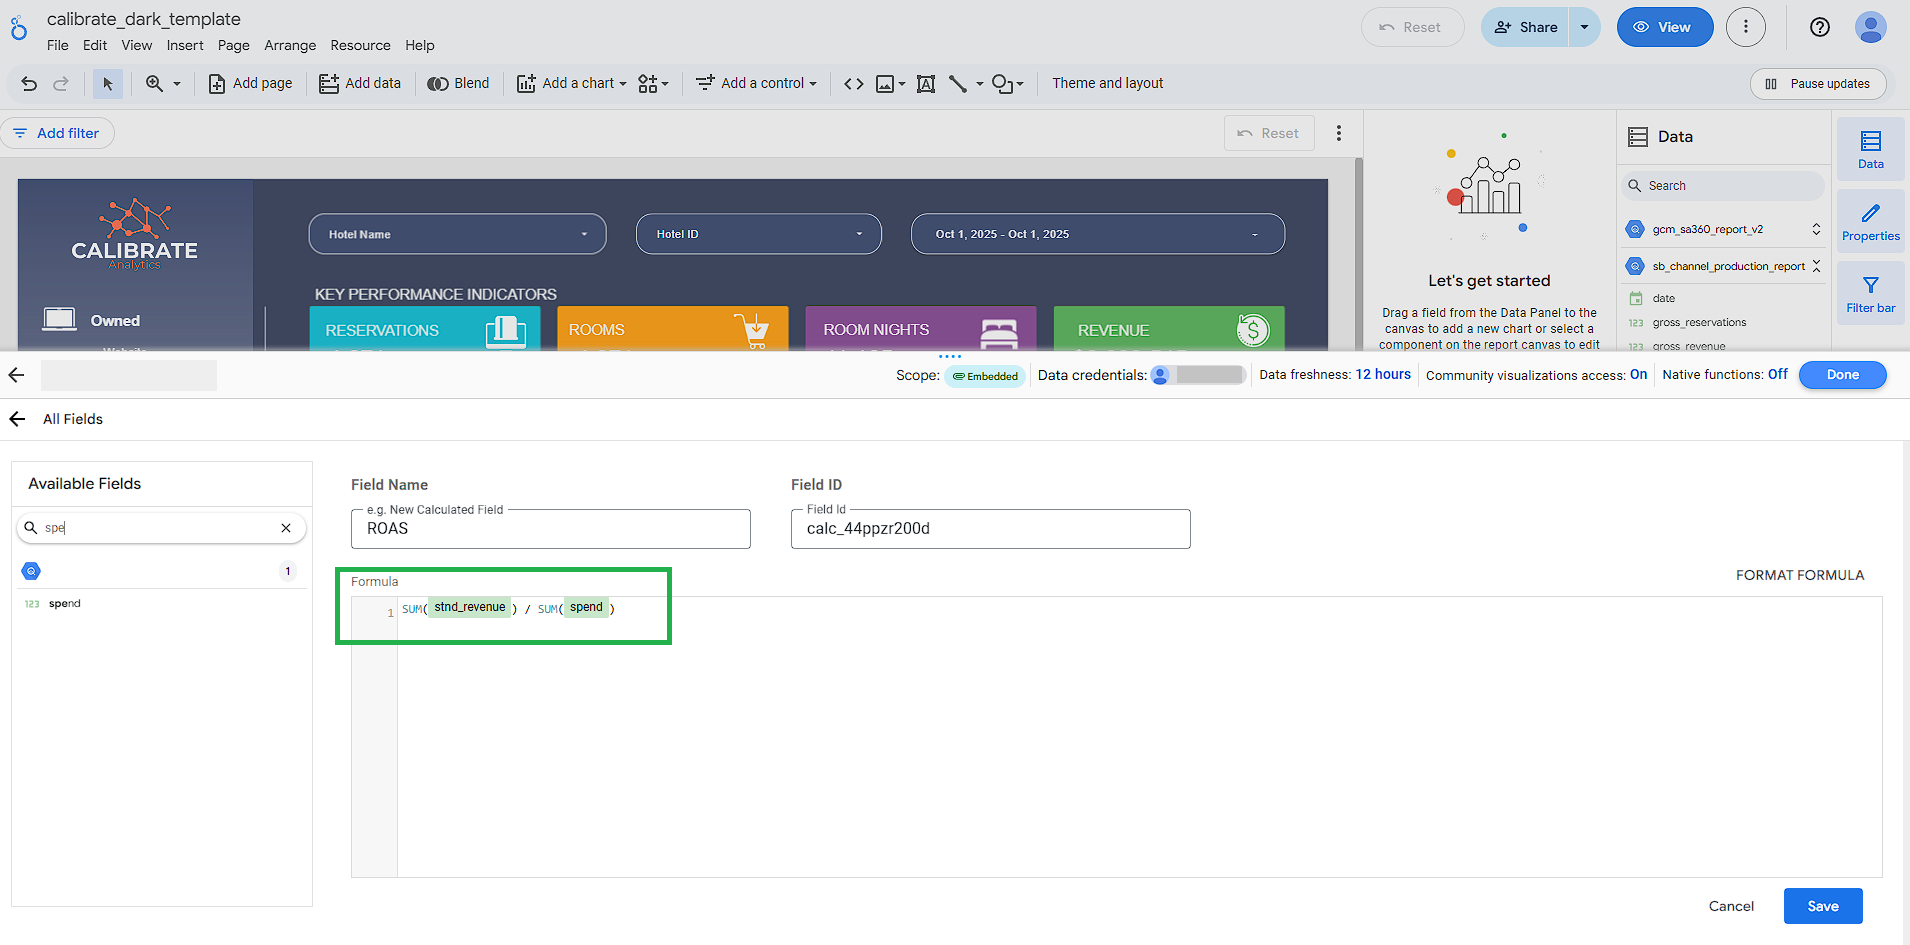
Do the math in the visualization layer. In your Looker Studio data source, click "Add a Field." You can use simple, Excel-like formulas here.
Typing SUM(revenue) / SUM(spend) into Looker Studio creates a new metric that behaves like it came from the database. You are effectively creating a new data column on the fly without touching the underlying BigQuery architecture.
Reference: https://docs.cloud.google.com/looker/docs/studio/about-calculated-fields
4. Data Blending: The No-Code "JOIN"
JOINs are one of the more intimidating parts of SQL. Combining data from two different tables based on a common identifier (like matching customer IDs from a "Sales" table and a "Support Tickets" table) can feel complicated if you are not used to database logic.
While complex joins are best left to SQL, you can fudge simple combinations within Looker Studio using "Data Blending."
How to fake it:
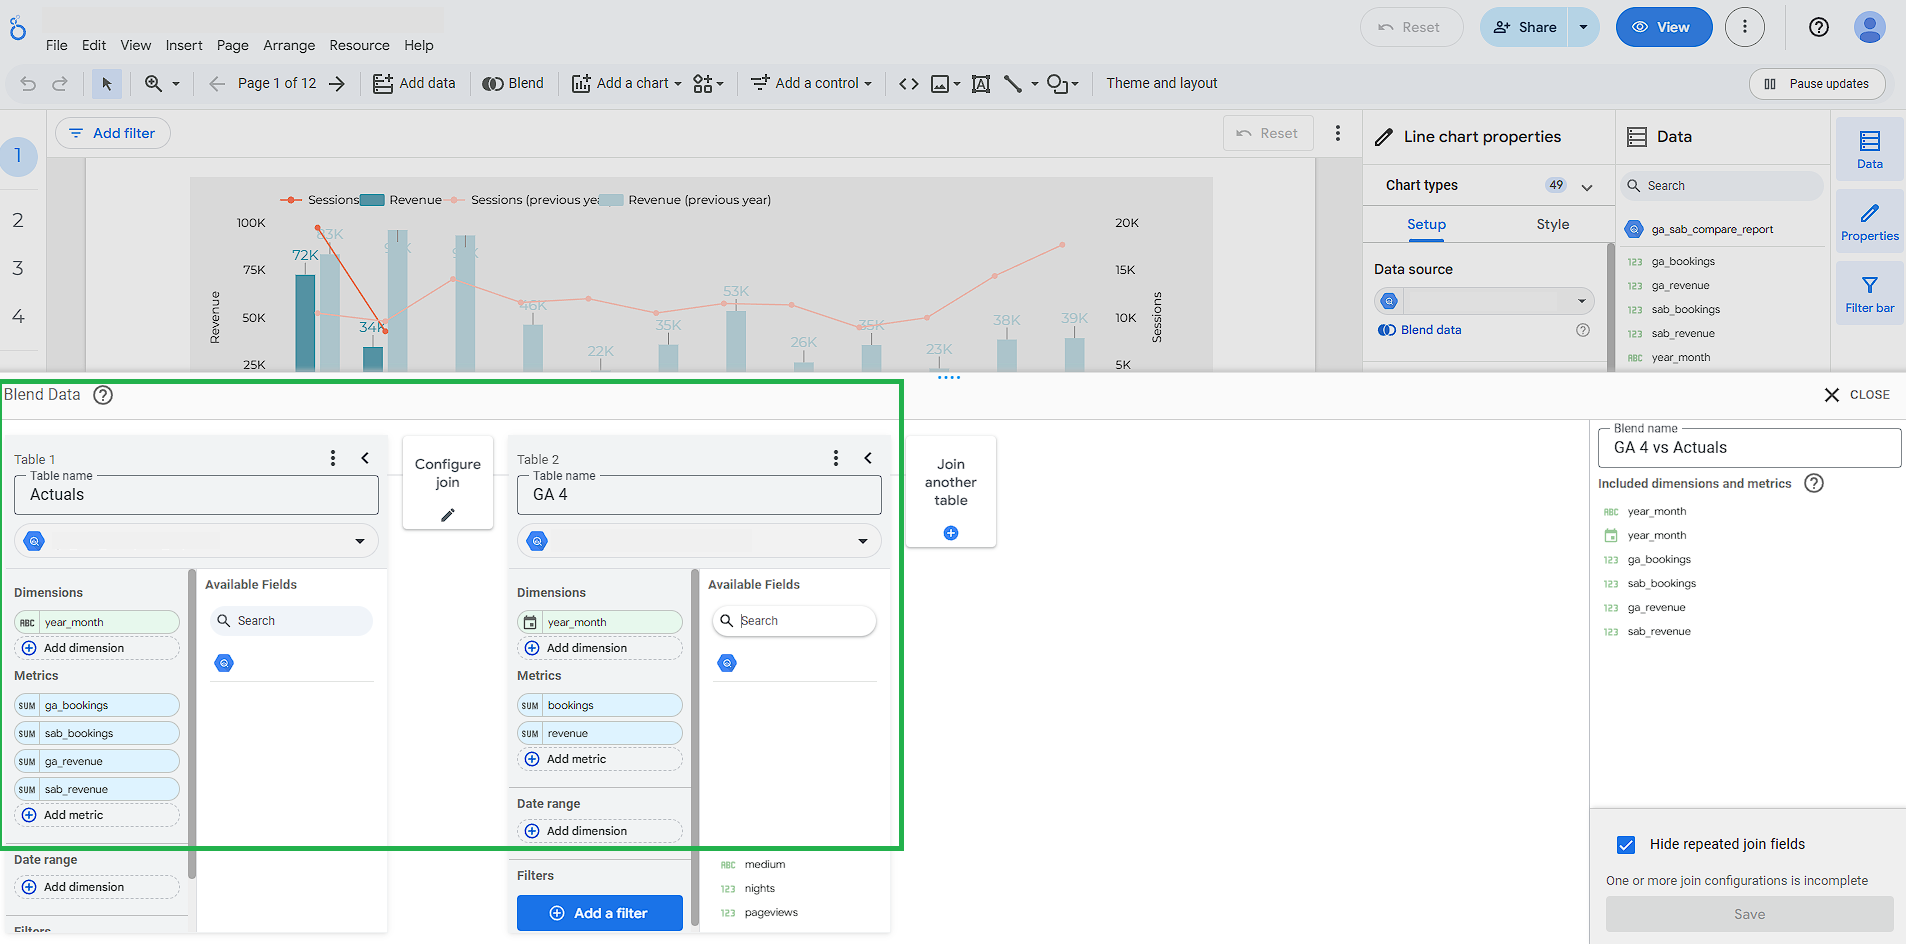
Let's say you have a BigQuery table with GA4 conversion data and another with Actual Sales data, and you want one chart showing total spend across both.
Instead of writing a SQL JOIN, add both tables as separate data sources in your Looker Studio report. Select a chart, open the data panel, click "Blend Data."
Looker Studio provides a visual interface to match the data sources based on a common key (like Date) and combine their metrics into a single view. It's a drag-and-drop alternative to complex database joins.
Reference: https://docs.cloud.google.com/looker/docs/studio/create-edit-and-manage-blends
5. Lean on Partitioned Tables for Speed
Two main concerns with BigQuery are cost and performance. Queries are billed based on how much data gets scanned, so inefficient queries over large datasets can get expensive.
Engineers solve this with table partitioning to break large tables into smaller segments, usually by date. Then, when a report uses a date filter, BigQuery only scans the relevant partitions.
You don't need to know how to create partitioned tables, but knowing how to use them makes you look like a query optimization expert.
How to fake it:
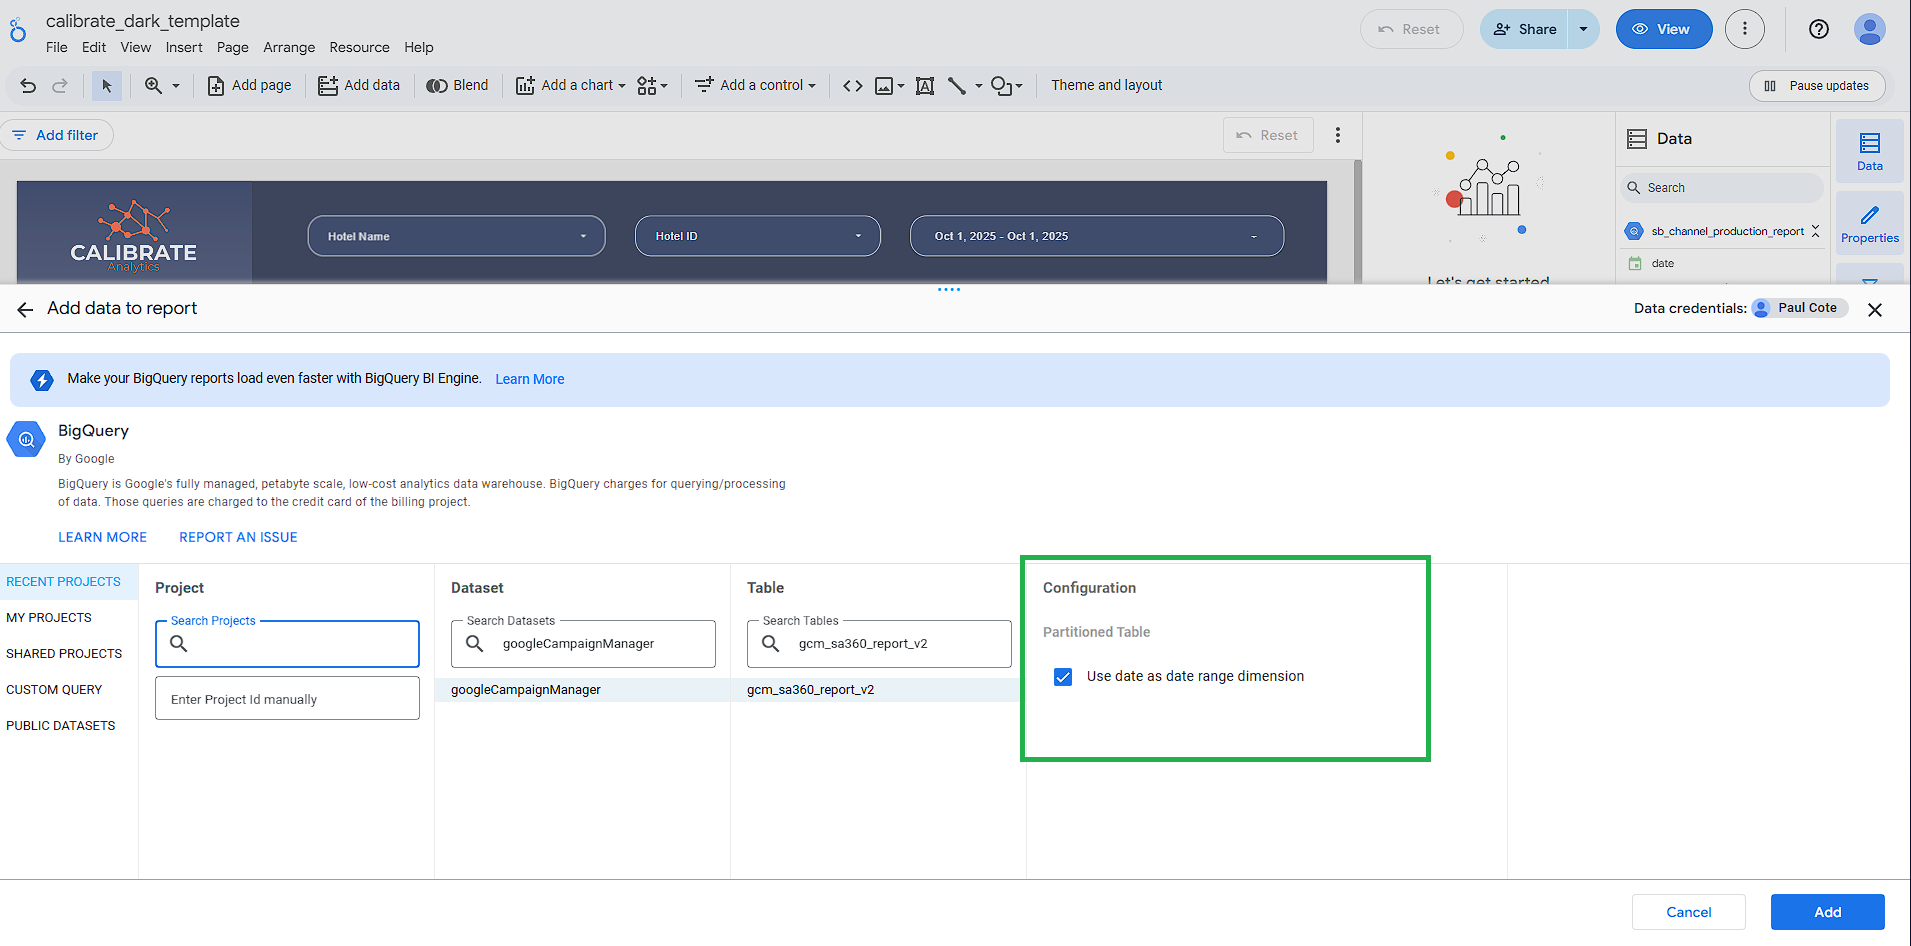
Ask your data team which tables are partitioned by date, then when you connect that table to Looker Studio, add a "Date Range" control to your report.
Since the table is partitioned, BigQuery will only scan the specific days you select in that control, rather than scanning years of data every time you load a chart without ever writing a WHERE _PARTITIONDATE = ... clause.
Reference: https://docs.cloud.google.com/looker/docs/studio/create-edit-and-manage-blends
Key Takeaways
You don't need to know how the engine works to drive the car. You don't need to be a SQL expert to work with Google BigQuery.
What you do need is a stack that separates raw data, transformations, and reporting into the right layers. When those pieces are set up correctly, Looker Studio becomes a simple interface on top of a powerful warehouse, and you save time while demonstrating expertise.
Curious to get started?