Dashboards are supposed to simplify reporting, but many marketing teams spend more time jumping between dashboards than actually analyzing performance.
Consider the different sources involved in a typical reporting workflow:
- GA4 for sessions and website conversions
- Google Ads for paid search results
- Meta and TikTok for social performance
- An email platform for campaign metrics
- A CRM for revenue and leads
Each platform runs on its own definitions and attribution rules, and none of them see the entire customer journey. That's where dashboards often start to break down.
Here are four reasons it happens and what you can do about it.
Reason 1: Conflicting Metrics and Siloed Platforms
Most teams don't have a single view into total performance across channels. Data lives in separate systems, each with its own interface and reporting logic, so it's hard to get a feel for overall results.
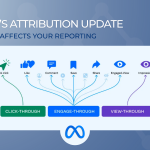
Ad platforms focus on their own conversions and view-through impact. GA4 measures sessions, events, and conversions based on its configuration. Your CRM tracks leads, opportunities, and closed revenue. Email tools report opens, clicks, and assisted conversions.
The conflicts usually show up in specific ways:
Conversion counts
A single purchase can be counted in Google Ads, Meta, and GA4, each using
different attribution windows and models.
Revenue totals
Ad platforms may report revenue based on conversion value passed through tracking,
but GA4 can attribute revenue differently depending on its model. The CRM records revenue only when a deal closes,
which could be weeks later.
Channel groupings
What GA4 labels as “Paid Social” might be broken out differently in ad
platforms. Branded and non-branded search may be separated in Google Ads but blended in analytics.
Time zones and reporting windows
One system may use account time zone, another property time
zone. Month-end numbers don't line up because the cutoffs differ.
When those differences aren't addressed, teams experience reporting fatigue. Every recurring report turns into a reconciliation exercise instead of a performance conversation.
Example scenario
A paid media team shows strong return on ad spend in-platform, while GA4 shows
lower revenue. Leadership questions the discrepancy, and the team spends the meeting reconciling definitions instead
of planning next steps.
Related article: Organizing Large Amounts of Data from Multiple Sources
Reason 2: Dashboards Mirror the Source Systems
Many dashboards simply connect to APIs and visualize the numbers as they exist in the source platforms.
While this allows for a centralized view, it doesn't fix any underlying inconsistencies with the data. If the numbers in the source systems disagree, the dashboard will display the same conflicts side by side.
You end up with a polished interface that still forces users to interpret competing numbers. The dashboard looks unified, but the logic behind it isn't.
Example scenario:
A marketing dashboard shows three different revenue figures on the same page:
platform-reported revenue, GA4 revenue, and CRM revenue.
Stakeholders don't know which one to use, so they default to whichever makes their channel look strongest.
Reason 3: Performance Issues Make Dashboards Hard to Use
Tools like Looker Studio often rely on live queries to connected systems. When those queries scan large datasets or multiple connectors at once, load times increase.
If a dashboard takes more than a few seconds to load, stakeholders stop using it consistently. Analysts revert to exports and spreadsheets because they feel faster and more dependable. At that point, the dashboard becomes a reference tool instead of a decision tool.
Example scenario:
An executive dashboard stalls during a leadership meeting. The team switches to
a static slide deck instead, and the dashboard becomes something people check after the fact, not during
decision-making.
Reason 4: No Trust In Data Accuracy
When each platform claims credit for the same conversions, there's no clear baseline for performance.
Marketing may reference ad platform revenue, while Analytics prefers GA4, and Finance trusts the CRM. Without a unified data model, each department defends its preferred system.
This slows down decisions and creates friction that has nothing to do with strategy.
What Actually Makes Dashboards Useful?
TL;DR it comes down to data accuracy and structure. The problem usually isn't the visualization layer. It's the foundation underneath it.
Dashboards work best when they sit on top of a centralized, standardized data model.
Here's how to get started:
Centralize Your Data in a Warehouse
Bring data from all marketing and analytics platforms into a
single environment like BigQuery or Snowflake.
Instead of querying five live connectors, your dashboard pulls from curated tables in one place. That creates a consistent base for reporting across channels.
As a result, a multi-channel ecommerce team can centralize ad, GA4, and CRM data in BigQuery. Then, instead of reconciling three revenue totals, they can define one revenue metric tied to actual transactions and use it everywhere.
Standardize KPIs and Attribution
Define your core metrics once:
- What counts as a conversion
- How revenue is recognized
- How channels are grouped
- Which attribution model is used for performance evaluation
Apply those definitions inside the warehouse before the data reaches your dashboard.
This is where you identify and resolve conflicts in detail:
- Align conversion windows across channels
- Map platform-specific dimensions into consistent channel groupings
- Reconcile revenue timing between transaction data and closed-won revenue
- Standardize campaign naming conventions
Once completed, your dashboard reflects one set of logic instead of five competing ones.
Use Structured, Pre-Processed Tables
Transform raw data into reporting-ready tables before
connecting your BI tool.
Pre-aggregated and standardized tables reduce heavy queries, improve load times, and simplify dashboard calculations. Instead of building complex logic inside the dashboard, you handle it upstream.
The result is faster reports and fewer surprises.
How Calibrate Approaches Dashboard Strategy
At Calibrate, the focus isn't on adding more dashboards, it's on improving the data foundation that supports them.
That means consolidating marketing and revenue data into a structured warehouse, aligning KPI definitions, and building dashboards on top of curated tables rather than raw connectors.
When your data is centralized and standardized, one dashboard can show blended performance across channels using consistent definitions. Conversions follow the same rules, revenue ties back to actual outcomes, and reports load quickly because they're backed by structured data.
Your dashboard stops being a reconciliation tool and starts supporting real performance decisions.
Curious to know more?