Most analytics tools are great at answering questions about individual records. How many customers placed an order? Which products sold the most? What was the average transaction value?
But many valuable insights come from understanding how your data is connected.
Which customers share the same device or payment method? Which products are frequently purchased together? How are suppliers, warehouses, and shipments connected? Which dashboards depend on a specific table before you make a schema change?
Those questions are much harder to answer with traditional SQL alone.
BigQuery Graph, currently available in preview, brings graph analytics directly into BigQuery. Instead of moving your data into a separate graph database, you can analyze relationships using the data that's already in your warehouse.
Google designed BigQuery Graph to give analysts another way to explore connected data without adding more infrastructure.
What Is BigQuery Graph?
Google created BigQuery Graph to support large-scale relationship analysis for use cases like fraud detection, recommendation engines, supply chain management, and knowledge graphs.
It models data using two building blocks:
- Nodes, which represent things like customers, products, orders, devices, locations, or marketing campaigns.
- Edges, which represent the relationships between those things, such as "purchased," "uses," "transferred to," or "depends on."
For example, a customer connects to an order, the order connects to several products, and the customer may also connect to a device or payment method.
Rather than analyzing each record independently, you can explore the network of connections surrounding your data.
This approach is incredibly useful when the relationship itself is the insight.
Analyze Connected Data Without ETL
Traditionally, using graph analytics meant copying data from a warehouse into a separate graph database. That meant building additional pipelines, maintaining duplicate datasets, and keeping everything synchronized.
BigQuery Graph works directly with data already stored in BigQuery. You can define a property graph from existing tables and views without creating another copy of your data. Your graph stays connected to the same governed data warehouse you're already using for reporting and analytics.
This helps you:
- Reduce duplicate data pipelines
- Keep graph analysis closer to real-time
- Maintain consistent security and governance
- Lower infrastructure and maintenance costs
It also allows relational SQL and graph analysis to work together. Teams can explore relationships with graph queries and then use the results in familiar SQL workflows.
Why Graph Queries Are Easier for Relationship Analysis
Many connected data questions become difficult to answer using SQL alone.
For example, a fraud analyst might want to identify customers who share devices, addresses, payment methods, and bank accounts. That often requires multiple joins or recursive queries.
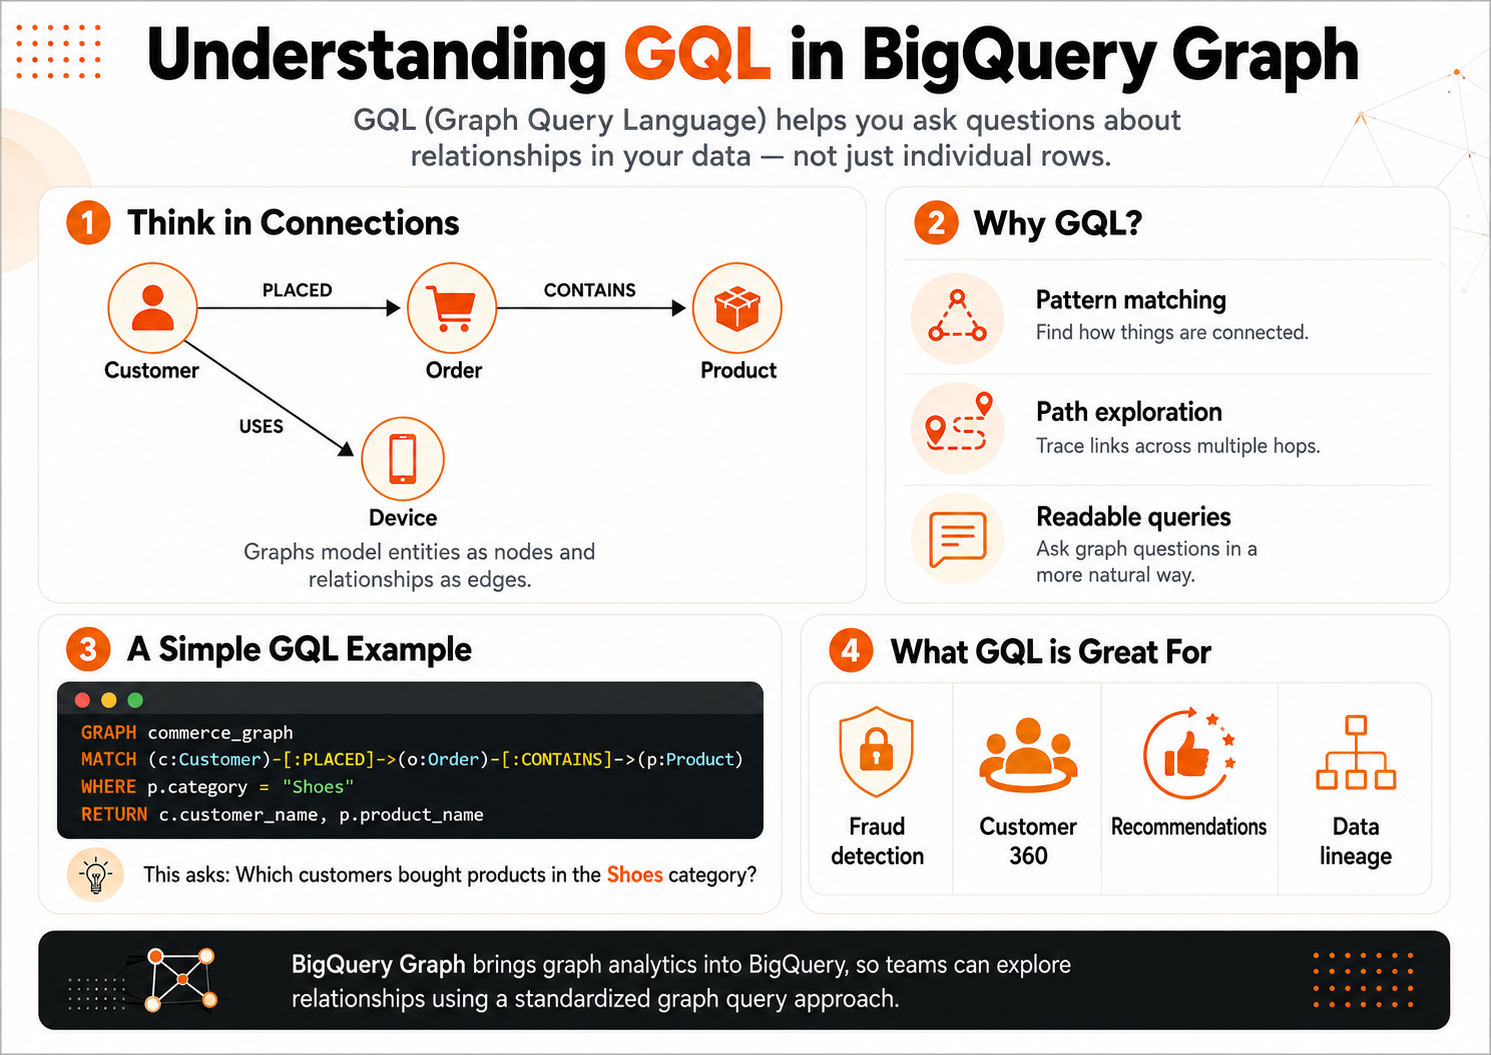
BigQuery Graph supports industry standards like Graph Query Language (GQL) and SQL Property Graph Queries (SQL/PGQ), allowing you to describe the pattern you're looking for instead of manually joining every table.
Instead of building a long chain of joins, a graph query can ask a question like: Which customers purchased products in the camping category during the past year?
The query follows the connections between customers, orders, and products instead of relying on long chains of joins.
The result is cleaner queries that are easier to understand, troubleshoot, and maintain.
Source: Introducing BigQuery Graph
Built-In Graph Visualization and Use Cases
Many relationship patterns are easier to understand visually than in a table.
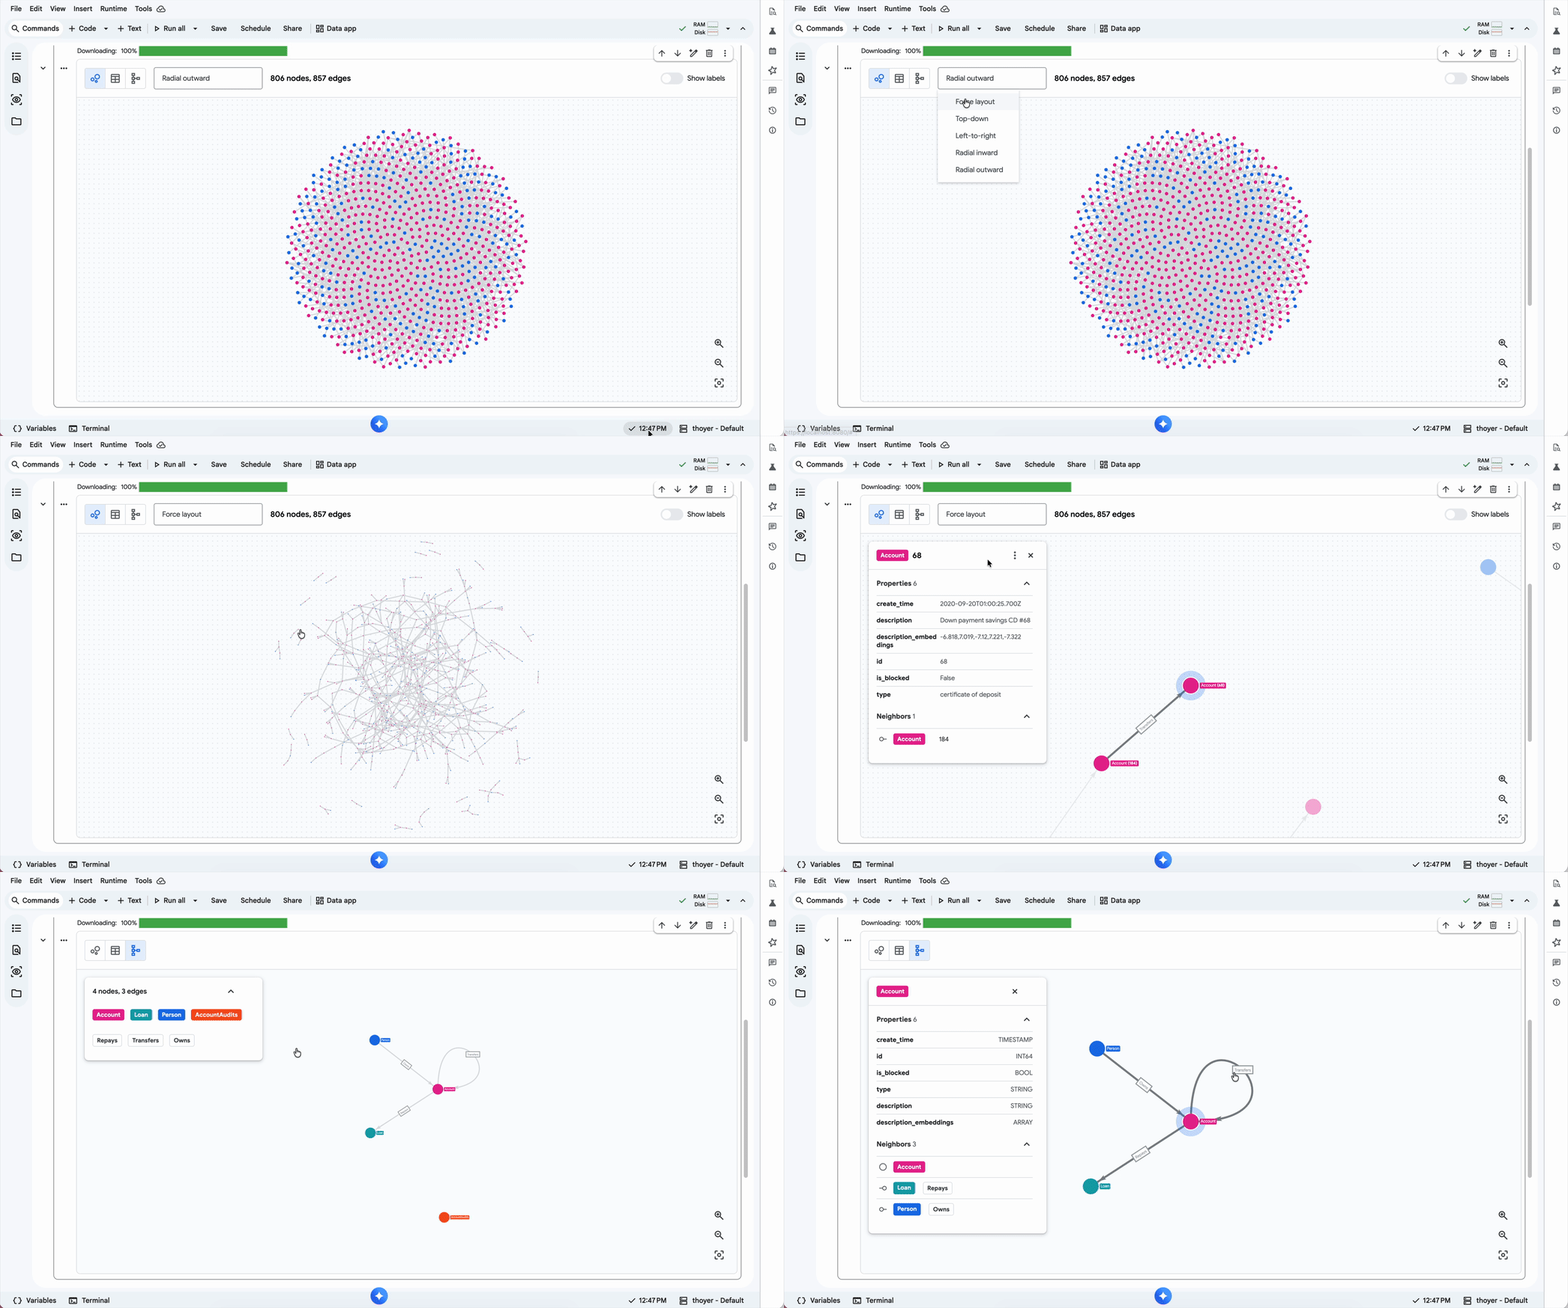
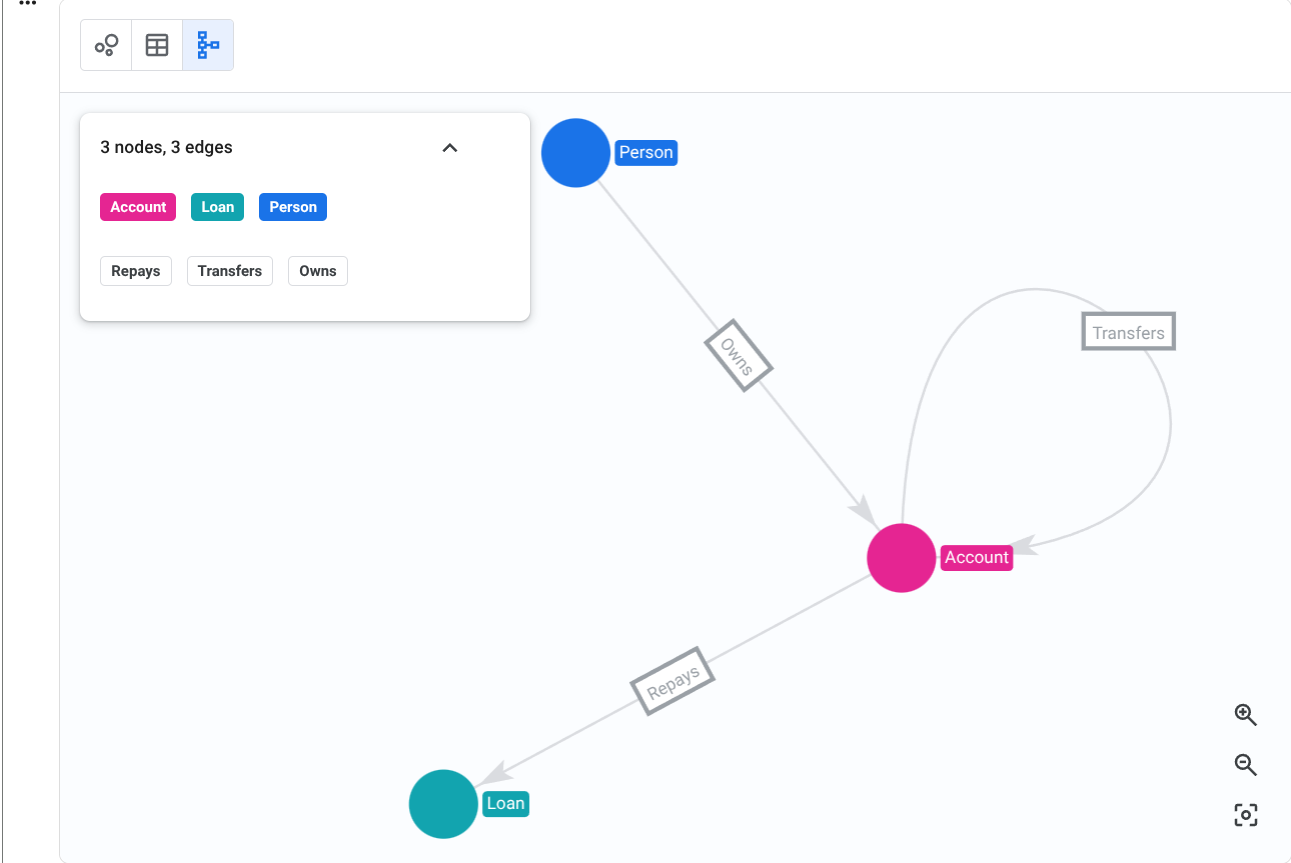
BigQuery Studio notebook allows you to display nodes and relationships directly from query results. You can quickly spot clusters, dependencies, central entities, and unexpected connections.
Suppose five customer accounts all share one device. A table can list the records, but a graph immediately highlights the shared connection.
| Customer | Device ID |
|---|---|
| Customer A | Device 123 |
| Customer B | Device 123 |
| Customer C | Device 123 |
| Customer D | Device 123 |
| Customer E | Device 123 |
Visualization is especially valuable for:
Fraud Detection
Identify accounts connected through shared devices, addresses, phone numbers,
payment methods, or transfer destinations.
Customer Journey Analysis
Connect customer activity across CRM systems, ecommerce platforms,
websites, loyalty programs, support systems, and advertising platforms to build a more complete customer view.
Product Recommendations
Combine purchasing history, browsing behavior, product categories, and
customer connections to improve recommendations.
Supply Chain Analysis
Visualize how suppliers, components, warehouses, shipments, and orders
connect so you can better understand the impact of disruptions.
Data Lineage
Map dependencies between source systems, ETL jobs, warehouse tables, dashboards, and
reports before making changes to production data.
It also makes technical findings easier to explain to business stakeholders.
AI and Vector Search Integration
Relationship analysis becomes even more useful when combined with BigQuery's AI and vector search capabilities.
Each solves a different problem. Relationship analysis explains how records are connected, while vector search identifies records that are similar in meaning.
Together, they provide richer context for AI applications.
For example, an ecommerce recommendation engine could use vector search to identify products similar to one a customer viewed, then enrich those recommendations with products frequently purchased by similar customers or commonly bought together.
The same approach can improve enterprise AI, helping AI assistants understand how customers, products, campaigns, and transactions relate while retrieving supporting documentation before generating a response.
Source: Introducing BigQuery Graph
Preparing Your Data for Relationship Analysis
While BigQuery Graph removes much of the infrastructure traditionally required for relationship analysis, the quality of your results still depends on the quality of your data.
Before analyzing relationships, you need reliable customer IDs, product keys, transaction records, device identifiers, and other shared keys in order to uncover meaningful connections.
At Calibrate Analytics, we help organizations consolidate marketing platforms, CRM systems, ecommerce data, cloud storage, and business applications into BigQuery.
That gives you a stronger foundation for reporting, AI, graph analytics, and future data projects.
If you're preparing your BigQuery environment for newer capabilities like BigQuery Graph, we'd be happy to talk through your data architecture and help you build a cleaner, more connected foundation.