The Floodlight pixel in Google Campaign Manager has a lot of great features, but it does not have the ability to convert currencies. If you've dealt with this issue, then you know that a revenue value that simply adds up different currencies without converting them properly is a useless metric. There are several solutions out there, but they almost always include a generalized or averaged exchange rate that is rarely updated (if ever).
Our solution to this problem uses the Exchange Rates and Google Campaign Manager sources in Launchpad to transfer daily currency exchange rates and Floodlight report data to Google BigQuery. We then use a basic query to summarize both datasets and apply the closing exchange rate for the corresponding day of the transaction value. The end result is data that has normalized currency and date-specific accuracy, ensuring your digital marketing reports can fuel the best possible insights.
Step One
Configure a Daily Exchange Rates transfer in Launchpad and load historic rates in BigQuery. Once you have backfilled all of the historic dates, you should configure your job in Launchpad to load the previous day's data before any other jobs run (we typically recommend running this job not long after midnight UTC).
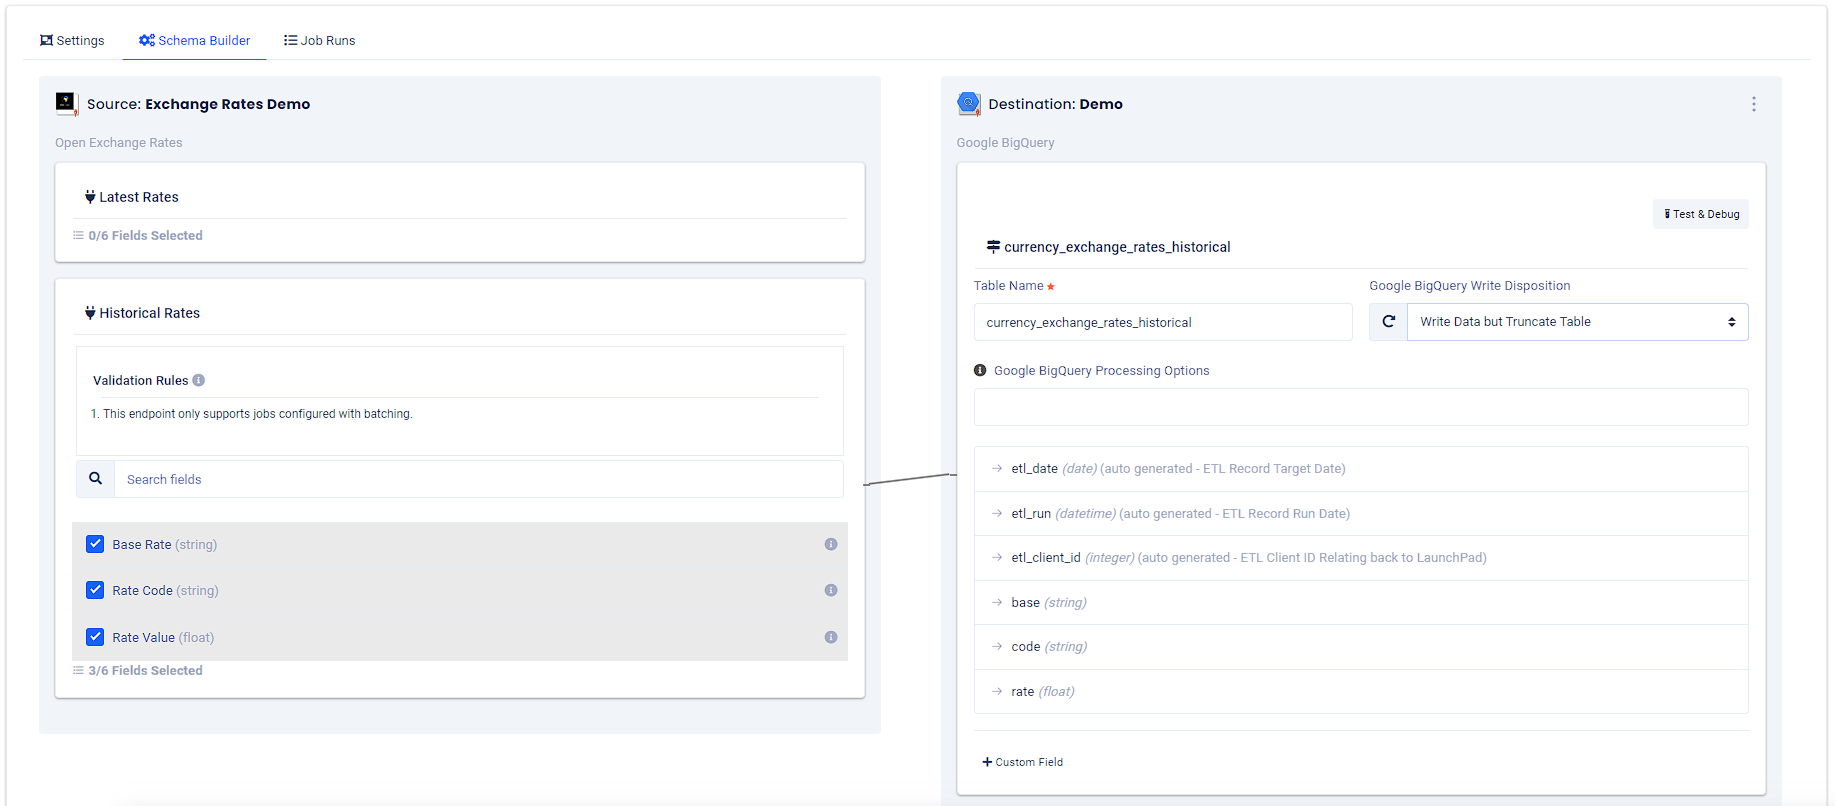
Example Exchange Rates Schema:
Historical Rates Endpoint (report)
Dimensions:
- Date (included automatically)
- Base Rate
- Rate Code
- Rate Value
Step Two
Configure a Google Campaign Manager transfer in Launchpad and send the transactional data from the Floodlight endpoint to Google BigQuery. Floodlight reports can be backfilled up to 60 days (“{today} - 60 days”). After you have completed your initial backfill, you'll want to configure Launchpad to update the table daily and refresh to the maximum attribution window you have set in GCM.
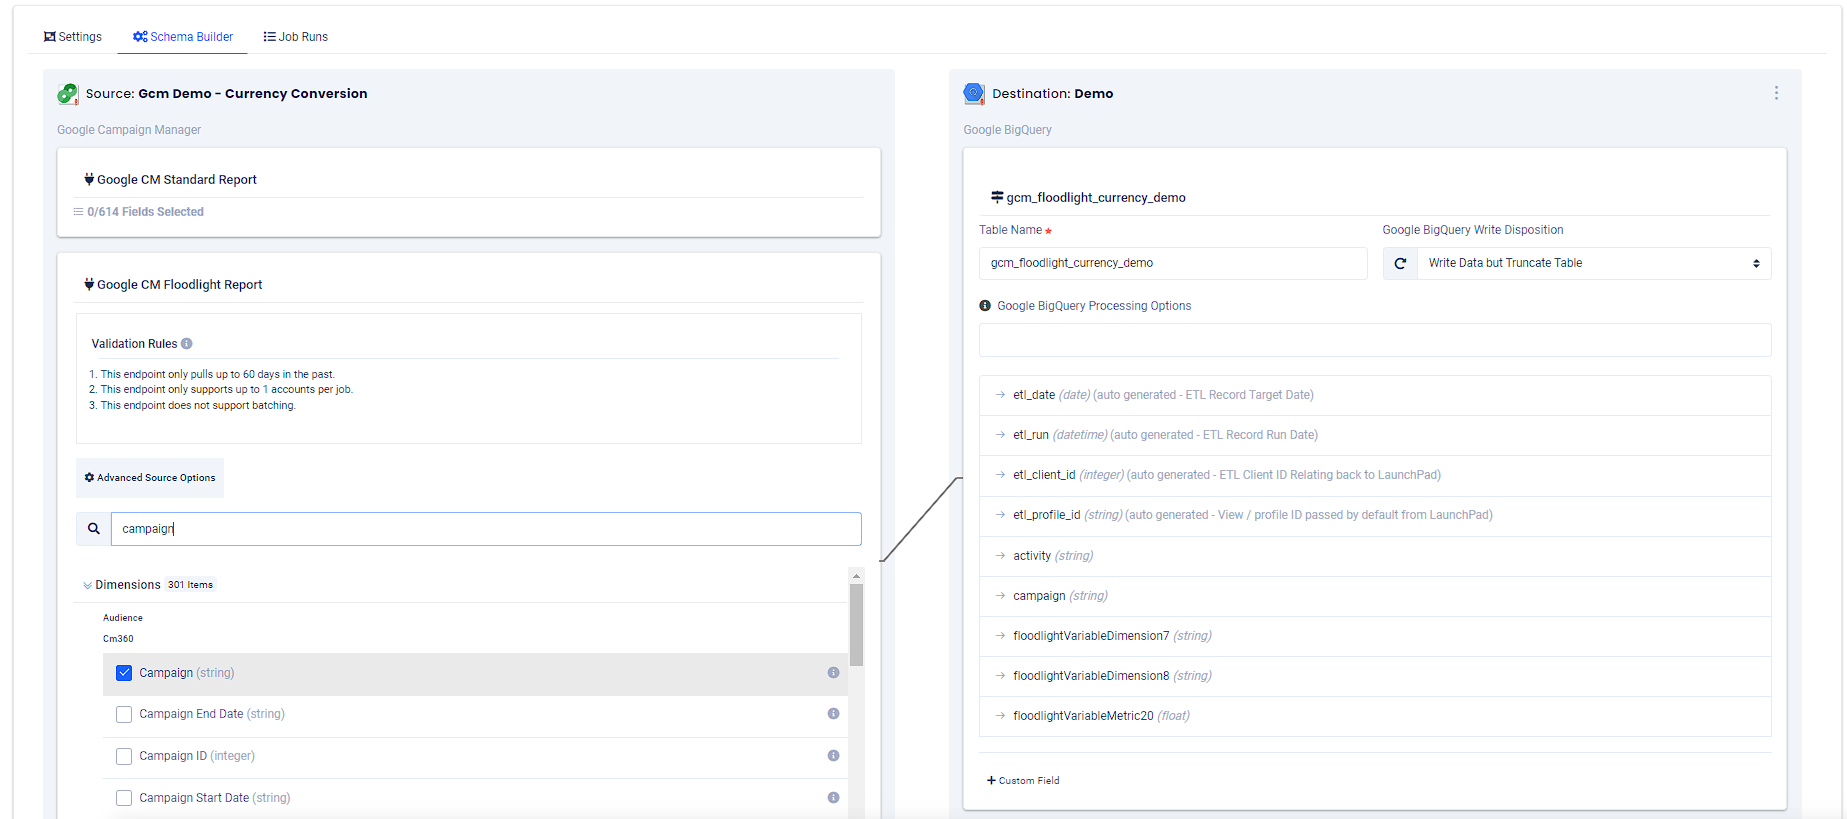
Example Google Campaign Manager Schema:
Floodlight Endpoint (report)
Dimensions:
- Date
- Activity
- Campaign
- Currency
- Transactions
- Revenue
Step Three
Copy and paste the query below into the query editor in your project.
- Update the table references in the “FROM” clauses to reflect the dataset and table names in your project.
- The sample query will convert currencies in THB, EUR, AUD and CAD. Update the currency codes to reflect the currency cases in your dataset.
- Run your query and check your data.
- Save as a view or table and connect your visualization app.
    WITH currency_pivot AS (
      SELECT * FROM
      (
          SELECT
          etl_date as date,
          code,
          rate
        FROM   `your-project-id.your-dataset-name.your-exchange-rates-table-name_2023*`
      )
      PIVOT
      (
        MAX (rate) AS  rate
        FOR  code in  ('THB', 'EUR', 'AUD', 'CAD') /* add the currency codes you'd like to include in your pivot*/
      )
    )

    SELECT
      etl_date AS date ,
      campaign,
      SUM ((CASE
        WHEN conv.Currency = 'THB' THEN  Revenue_Before_Tax * (1 / currency.rate_THB)
        WHEN conv.Currency = 'EUR' THEN  Revenue_Before_Tax * (1 /currency.rate_EUR)
        WHEN conv.Currency = 'AUD' THEN  Revenue_Before_Tax * (1 /currency.rate_AUD)
        WHEN conv.Currency = 'CAD' THEN  Revenue_Before_Tax * (1 /currency.rate_CAD)
        ELSE Revenue_Before_Tax
      END)) AS revenue,
      COUNT(DISTINCT Transaction_ID) AS bookings

    FROM `your-project-id.your-dataset-name.your-google-campaign-manager-table-name` AS conv

    LEFT JOIN (
      SELECT
         date,
         rate_EUR,
         rate_THB,
         rate_AUD,
         rate_CAD

      FROM `currency_pivot` /* select currencies that need to be converted in the report data */

    ) AS currency

    ON DATE(conv.date) = currency.date
    WHERE etl_date BETWEEN DATE(2023,01,01) AND CURRENT_DATE() - 1

    GROUP BY
      date,
      campaign

    ORDER BY
      date
Need Help?
If you need any assistance automating your data transfers and reporting, then you've come to the right place. The experts at Calibrate Analytics can help set up your analytics stack so that you never miss the best insights.