A very popular feature in Google's Universal Analytics (now sometimes referred to as GA3) was the ability to create separate views. Views were an easy way for you to segment your data and drill down into your analytics, such as viewing data from a specific subdomain or demographic. Now that users are transitioning away from Universal Analytics and making the switch to Google Analytics 4, many of them will be hoping to find the same feature.
Despite many positive changes and new features, GA4 does not currently offer the ability to create views into your data in the way that Universal Analytics did. Some users have been creating multiple GA4 properties as a work-around, but this is not the same as creating views in Universal Analytics, and Google explicitly states not to do this.
It's not clear at this time if Google has any plans to add the views feature to GA4, but not all hope is lost. The experts at Calibrate are here to share some easy-to-implement (and free!) ways to segment your data that will be similar to the views in Universal Analytics.
GA4 Accounts, Properties, and Data Streams
The first step to segmenting your data is understanding how accounts, properties, and data streams are structured in GA4. Google recommends creating one GA4 account per company. This is the larger entity that has legal ownership over all the data.
Within an account, you can create multiple properties. Properties live within an account and represent data for one user base. Properties should be created for data that would generally be analyzed together, such as for a product line, brand, or application.
Lastly, within each property, you can have multiple data streams, which are the sources of data from an app or website. Google recommends using a maximum of three data streams per property: one single web data stream to measure the web user journey and one app data stream each for iOS and Android.
Source: [GA4] Google Analytics account structure
For users with the paid version, Google Analytics 360 (GA360), there are even more options, including subproperties that allow for further segmentation and roll-up properties that combine multiple properties into an aggregated view. However, each event that gets sent to a subproperty or roll-up property is processed again and counts as 0.5 hits toward your billing quota.
(1 hit for source property + 0.5 hit for subproperty + 0.5 hit for roll-up property = 2 hits billed)
For users that do not want to pay for GA360, the question of when to use multiple data streams comes down to whether or not cross-domain tracking is required. If cross-domain tracking is needed, then you should use one data stream for the entire parent/chain site. If no cross-domain tracking is needed, Google suggests multiple data streams — one per entity that requires unique Google Ads linking. According to Google, “Cross-domain measurement is configured within a single data stream, so a single user whose data is collected in multiple data streams is counted as a separate user in each data stream.”
Source: [GA4] About roll-up properties
If cross-domain tracking is not needed and your data needs to be separated by segment, Google suggests that you create separate GA4 data streams per subsidiary. This may be the case if each subsidiary is managed by different marketing teams, with each subsidiary needing to create audiences and track conversions associated with separate Google Ads accounts.
Segmentation in Google Analytics 4
Aside from accounts, properties, and data streams, there are other features built into GA4 that provide you with the ability to segment your data. Explorations and audiences are both versatile, powerful features that you should learn about and leverage in your reporting.
GA4 Explorations
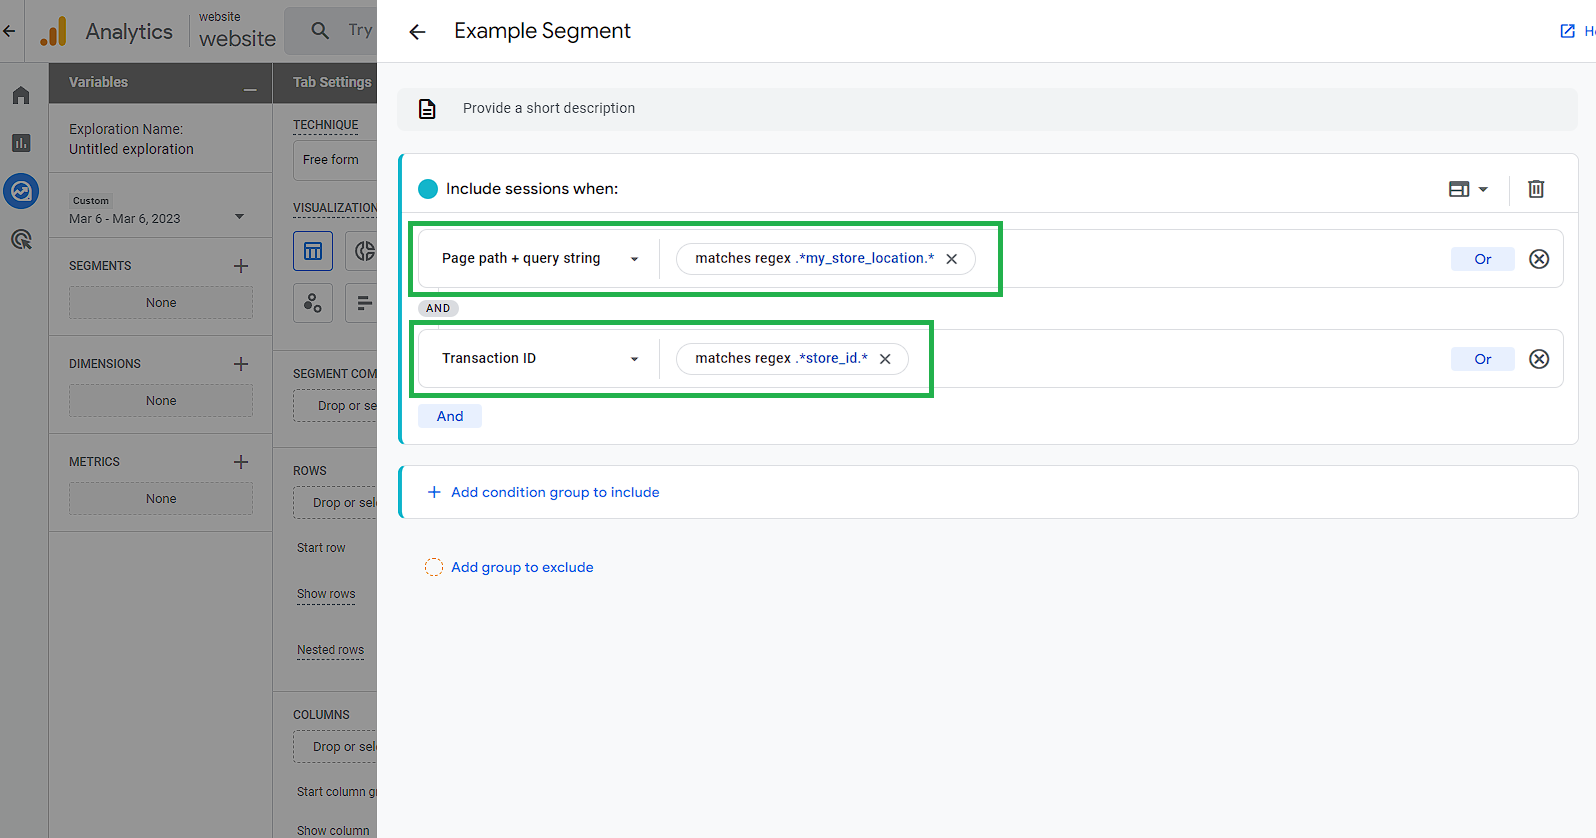
Explorations in GA4 provide a custom report canvas that can be configured to replicate views in Universal Analytics. The best use case for this would be when you have a set of metrics and dimensions to report on that are not available in the GA4 default reports. With explorations, you can apply segments and filters to narrow down the subset of data that traditionally would have been a view in Universal Analytics.
Creating a GA4 Exploration segment
Bonus:
- Page Path Exploration: used to see flow between parent site and sub-sections.
- Landing Page Exploration: used to show how many users landed on parent vs. subsidiary (using session_start event)
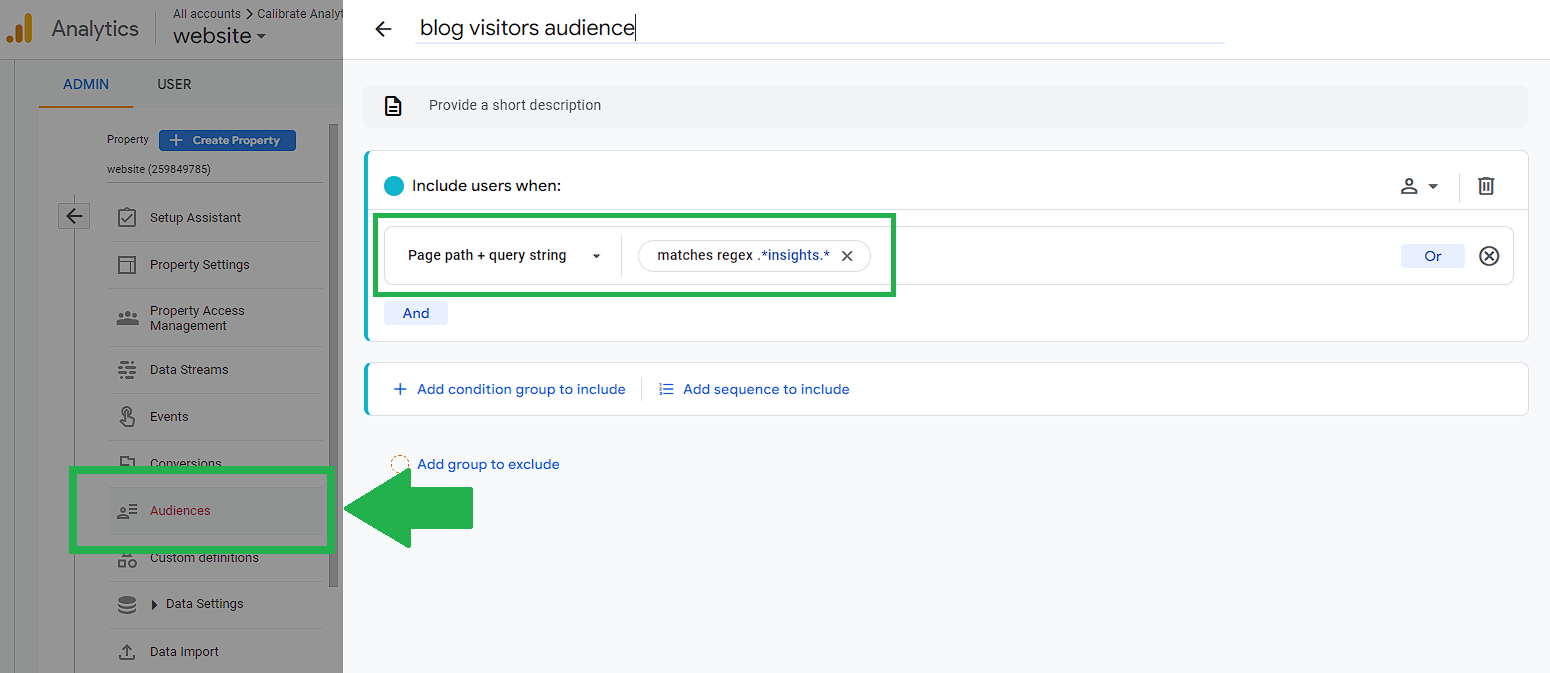
GA4 Audiences
GA4 allows you to create audiences based on a set of filters that you define. You can create an audience list based on web activities that occurred in the past, or it can be set to only build the list from activities going forward. If you have a parent site with subsidiary site sections, you can use this to define an audience list that is specific to the subsidiary. Audience Setup
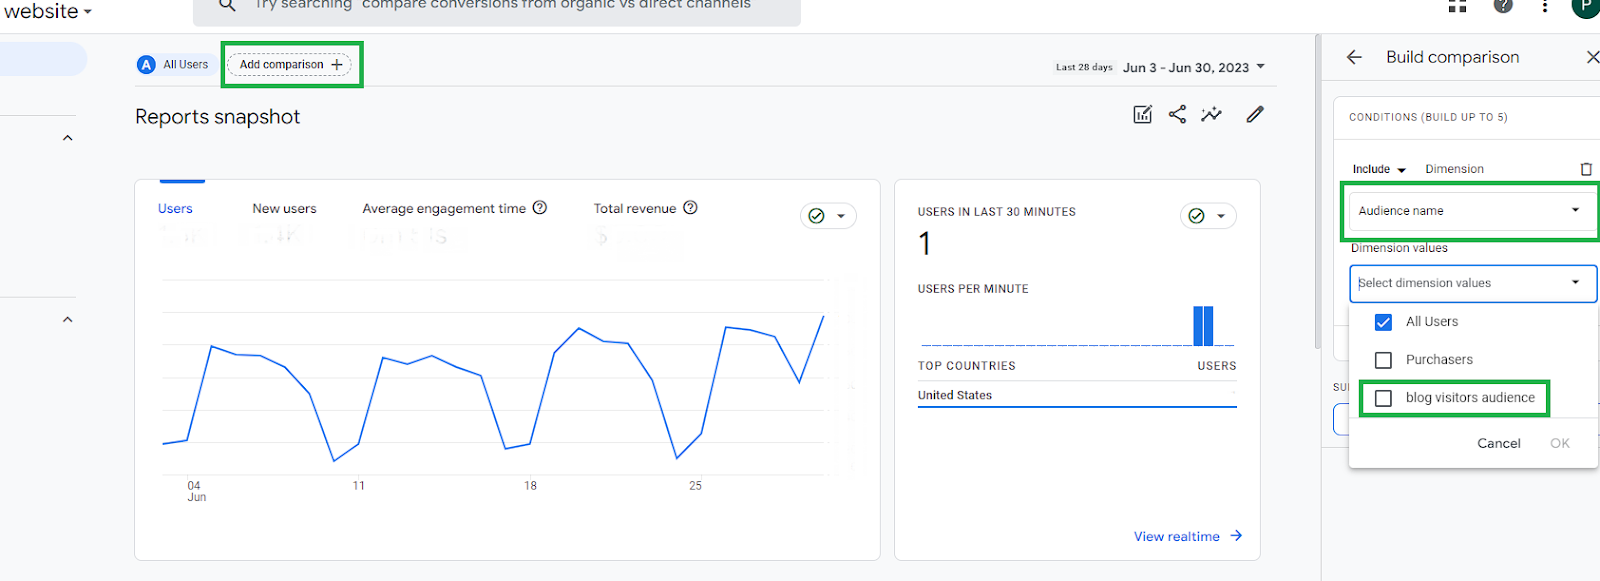
Applying an audience to your dashboard
Using Filters in BigQuery
In addition to segmenting directly in GA4, you can also manipulate your data once it has been transferred to a data warehouse. BigQuery in particular offers filtering options that add a lot of flexibility for your datasets, which can then be connected to the visualization apps of your choice, such as Looker Studio.
Page Path Filter
Within BigQuery you can filter GA4 datasets to only include event hits that occurred on a specific subsection of a parent website.
Example:
REGEXP_CONTAINS(page_location, r'.*store-specific-url|.*store\=59780.*')
You can then use those queries to establish BigQuery tables and views for each subsidiary within the parent site. This allows for flexible filtering within the GA4 BigQuery dataset. However, this method requires ongoing maintenance to the query logic if the website URLs change.
Sample Query For GA4 Dataset
        WITH store AS (
            SELECT
              PARSE_DATE("%Y%m%d", event_date) AS date,
              user_pseudo_id,
              (
                SELECT value.int_value
                FROM UNNEST(event_params)
                WHERE KEY = 'ga_session_id'
              ) AS session_id,
              traffic_source.medium AS medium_first,
              traffic_source.source AS source_first,

              MAX((
                SELECT value.string_value
                FROM UNNEST(event_params)
                WHERE key = 'medium'
              )) AS medium,

              MAX((
                SELECT value.string_value
                FROM UNNEST(event_params)
                WHERE key = 'source'
              )) AS source,

              COUNT(DISTINCT(user_pseudo_id)) AS users,

              COUNT(DISTINCT(
                SELECT value.int_value
                FROM UNNEST(event_params)
                WHERE key = 'ga_session_id'
              )) AS sessions,

              COUNT((
                SELECT value.string_value
                FROM UNNEST(event_params)
                WHERE key = 'page_location' AND event_name = 'page_view'
              )) AS pageviews,

              COUNT(DISTINCT IF(event_name = 'first_visit', user_pseudo_id, NULL)) AS new_users
              FROM `your-project-id.analytics_your-id.events_*`
              CROSS JOIN UNNEST(event_params)
              WHERE _table_suffix BETWEEN format_date('%Y%m%d',date_sub(current_date(), interval 3 day)) AND format_date('%Y%m%d',date_sub(current_date(), interval 2 day))

                    /*---------------------------------------- ADD URL STRINGS HERE --------------------------------- */


                    AND key = 'page_location' AND REGEXP_CONTAINS(value.string_value, r'page_url_filter') /*replace page_url_filter with all string variants of the pages you would like to include in the results */


                    /*----------------------------------------------------------------------------------------------- */

            GROUP BY
              date,
              user_pseudo_id,
              session_id,
              medium_first,
              source_first
          ),

          core AS (
            SELECT
              PARSE_DATE("%Y%m%d", event_date) as date,
              user_pseudo_id,
              (
                SELECT value.int_value
                FROM UNNEST(event_params)
                WHERE KEY = 'ga_session_id'
              ) AS session_id,
              COUNT(DISTINCT IF(event_name = 'purchase', CAST(ecommerce.transaction_id AS STRING), NULL)) AS bookings,
              SUM(IF(event_name = 'purchase', ecommerce.purchase_revenue_in_usd, 0)) AS revenue,
              SUM(IF(event_name = 'purchase', ecommerce.total_item_quantity, 0)) AS nights

          FROM `your-project-id.analytics_your-id..events_*` AS stats

          WHERE _table_suffix format_date('%Y%m%d',date_sub(current_date(), interval 3 day)) AND format_date('%Y%m%d',date_sub(current_date(), interval 2 day))

                /*-----------------------------ADD STORE IDENTIFIER IN TRANSACTION ID HERE--------------------------- */


                AND REGEXP_CONTAINS(ecommerce.transaction_id, r'^storeId.*')  /* matches strings in the following format {storeId}{transactionId} */


                /*--------------------------------------------------------------------------------------------------- */

          GROUP BY
            date,
            user_pseudo_id,
            session_id
          )

          SELECT
              store.date,
              IF(store.medium IS NULL, store.medium_first, store.medium) AS medium,
              IF(store.source IS NULL, store.source_first, store.source) AS source,
              SUM(store.sessions) AS sessions,
              SUM(core.revenue) AS revenue,
              SUM(core.nights) AS nights,
              SUM(core.bookings) AS bookings,
              SUM(store.users) AS users,
              SUM(store.pageviews) AS pageviews,
              SUM(store.new_users) AS new_users

          FROM store

          LEFT JOIN core

          ON store.date = core.date AND store.user_pseudo_id = core.user_pseudo_id AND store.session_id = core.session_id

          GROUP BY
            date,
            medium,
            source
Event Parameter Filter
If you have developer resources at the start of a project, the best option is to have a custom parameter added to all events that occur on a specific subsection of the site.
Example:
'store_id': 'ae542'Not every organization has the time or resources to thoroughly implement this solution, but if the investment is made up front, filtering the data can become simpler and more reliable than ad-hoc page path filtering.
Calibrate Is Here to Help
In today's data-driven world, maintaining accurate records and being able to analyze that data effectively are imperative to success. Thankfully, the experts at Calibrate Analytics are ready to guide you through the process of setting up GA4, segmenting your data, and creating the views and dashboards you need to manage your business and fuel long-term growth.